Food Blog Study Update
I heard there was a graduate student once who used egg timers to break her dissertation down into writeable chunks. She had these timers all over the apartment, flipping one over to start a new bout of writing. Once it ran out, she might keep on writing since there was no buzzing or beeping to interrupt her. If she looked up and the sand had all run through, she would flip over another egg-timer to measure out a dose of ‘free-time’. Maybe I had her strategy in mind while I was trying to come up with a way to monitor progress on the food blog study. Large, long-term projects can envelope me, making it hard to see either where (and why) I started the project and where I mean to end up while I’m toiling away in the trenches of the day-to-day. This post is not about a final product. Rather it is about how I use information graphics to help me keep my mind on both the questions I started with and the place I mean to end up when all is said and done.
The food blog study is broken into three parts. The interviews (N=22) have all been conducted and are out being transcribed. The survey cannot begin until the web crawler has gotten to a stopping point. So where do things stand with the web crawler? That is not an easy question to answer except to say that it is doing what good bots do, chugging along finding food blogs to add to its growing collection with minor down times for maintenance here and there.
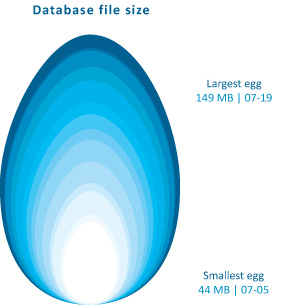
The graphic above demonstrates how the network set is growing – I simply used the file size of the daily cumulative db output to tell me how big to make each day’s egg. Still, looking at file size is kind of silly – it does not help me figure out when the network has been sufficiently crawled. It simply represents the absolute size of the database and because I do not have some target absolute size as my endpoint, knowing the current absolute size is mere trivia and not analytically useful.
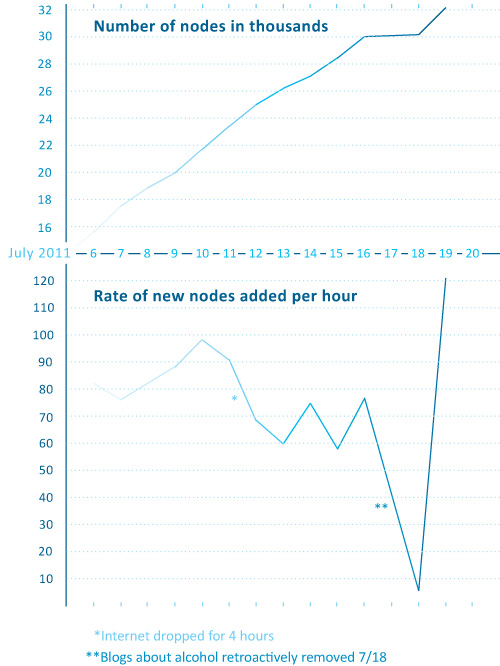
Rather than considering absolute size or the linear growth of the network data, it is a lot more meaningful to examine the rate of change of new nodes from one day to the next. For comparison sake, I graphed both the linear growth of the network (top graph) and the number of nodes added per hour for each day in July (bottom graph) with the exception of July 17th when the crawler was down for maintenance. The linear growth is chugging along consistently enough with a few exceptions for reasons like maintenance and accidents (someone unplugged my computer from the internet for six hours one day. oops.). The rate of new food blogs added to the network set per hour is finicky, a pattern that is much easier to see in the bottom graph. That graph was calculated by taking the number of new food blogs added to the network during a given run and dividing it how long the run lasted to generate an hourly rate of growth. That hourly rate is what is plotted below – the crawler’s sweet spot seems to be when it is adding about 60 – 90 new food blogs per hour.

The plunge in the rate of new blogs added per hour around the 18th of July is artificial. I happened to add a command that day which retroactively removed all of the blogs primarily focused on cocktails, wine, and beer. Their removal nearly outweighed the new food blogs that were added to the network that day so the overall rate of new blogs added appears to be extremely low at only 6 per hour.
This graph is extremely useful for keeping in mind where I started and helping me to figure out when I have gotten some where. I will know that the food blog bot is exhausting new nodes and that I have started to run into the bounds containing the food blog network when the rate of newly discovered food blogs per hour starts dropping and does not recover. Right now, the crawler is still pulling in new entries fairly rapidly so I know I am probably going to be babysitting it for at least another week. Thus far, the roughly-cleaned network includes about 32,000 nodes. Yes, folks, that means there are greater than 30,000 food blogs out there in the world. Probably a lot more, especially because the bot speaks food in English, Spanish, French, Italian, and German so the network under consideration is multi-national though not quite global.
Note on graphics
Could that egg have been perfectly round? Yes. And would perfectly round circles have been easier for average humans to measure with their eyes? Yes. So why did I choose an egg shape? Because I feel like this project is an incubation period. Data collection can be a delicate process – I would say that is especially true with respect to the web crawler because it was a tool custom-built for this project and thus has not been used and tested elsewhere. I also chose an egg because it is not important if viewers understand exact figures – this graphic was intended to provide an impressionistic view of the rate of growth of the network that the crawler is gathering. It grows incrementally, not by leaps and bounds. Like tree rings, the concentric nature of these eggs demonstrates that some days generate fatter rings than others.
As for the two graphs, I wanted to try using the same horizontal access because I wanted to make sure people understood that those two graphs are best understood as a pair. Basically, one is the derivative of the other, though there’s no need to pull out your calculus textbook just to understand these two. The top one just shows the total number of food blogs in the network so far. The bottom one shows how fast new blogs are being added from day to day. I didn’t want to clutter up the graphs with too many words so I opted to go with a single horizontal access, short titles, no labels for the vertical access (they are implied in the title), and I kept the two points about strange days outside of the bounds of the bottom graph. I don’t know if it is acceptable to stick asterisks in a graph, but I did it.
References
Noren, Laura. (2011) Food Blog Study.
