What works
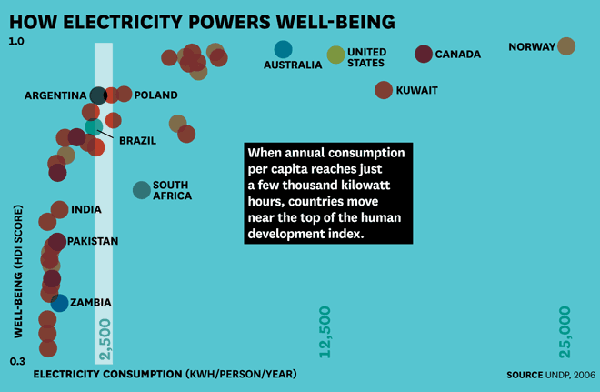
Infrastructure is a critical resource for supporting basic human life and this graphic does a good job of indicating the geometrical returns to electrical infrastructure in poor places. A little bit of electricity goes a long way.
Electricity doesn’t cause well-being, of course. But it is a powerful enabler. When people have lights that allow them to study and work after dark, refrigeration to keep foods and medicine fresh, pumps and purifiers to irrigate farmland and produce safe drinking water, and cell phones and computers to connect them with commercial, educational, and health care resources, they can more fully participate in the social and economic activities that drive human development.–Arun Majumdar
What needs work
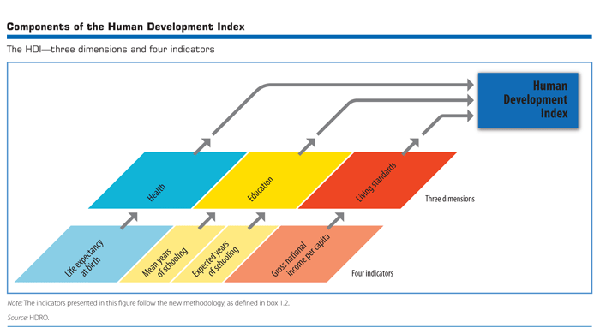
The Human Development Index should be spelled out a little in graphics like this until it is clear that the average person on the street knows what is represented by the Human Development Index. [To the author’s credit, he does outline the components of the HDI in the text.] It can be a very tricky metric. The Human Development Index used by the UN uses four measures: life expectancy at birth, mean years of schooling, expected years of schooling, and gross national income per capita to create the human development index for a country. They use two measures of education so that they can be more sensitive to changes as they happen. It takes a long time to change the mean educational attainment in a country even if that country has recently put in place policies and infrastructure to educate more children for a longer period of time. All of the measures are chosen because they are relatively easy to measure and because most countries have at least sort of reliable data for all four measures.

I also don’t like that all of the wealthier countries are labeled but only some of the poor countries in the lower left are labeled.
I assume the colors refer to continents. A key would have helped.
To help viewers understand kilowatt hours, I would have liked to see some comparison between something a typical person would be familiar with and this magical 2500 kilowatt hour/person/year threshold. How many days could I power my iMac at that rate? A month? Half a year? What about my refrigerator? I have no idea how much 2500 kilowatt hours might be.
References
Majumdar, Arun. (2012) Electrifying the bottom of the pyramid Harvard Business Review.
UNDP. (2011) Human Development Index.
