inequality

Image: Three white-appearing healthcare workers, “Thank you – You are our heroes” courtesy of 18371568 via pixabay CC0.  This imagery suggests our heroes are white, even though around 25% of nurses in the U.S. are people of color. Furthermore, signage that says we “thank our heroes” does not match up with how frontline workers have been unsupported by leadership. Images like this mask structural inequality (pun intended) under the guise of all being “in this together.”

We have seen many things described as “unprecedented” as the year 2020 has steamrolled over many of us. Among them, the pandemic has given the world an unprecedented illustration of U.S. racial inequalities. For example, Black people are more likely to die from COVID-19 infections than are people in any other racial group, and this is true even after controlling for income, housing conditions, and underlying health conditions. Yet not all Americans are able to see the racial inequalities that have been unmasked.

Sociologist and race scholar Eduardo Bonilla-Silva insists that the key to understanding race and racism in the United States is understanding how colorblind ideals shape Americans’ thinking and public discourse. Examples of what Bonillia-Silva calls color-blind racism are phrases such as “We are all in this together” or “Covid is the great equalizer” because they serve to draw attention away from the racial disparities that are otherwise so persistent and pronounced.

Color-blind racism is named after the hypothetical White observer who says they “do not see color” while they, simultaneously, fail to see existing racial inequalities. In other words, colorblind framings mask deep, structural inequalities. People may feel like they are saying unifying things with these tropes, but this sort of “all in this together” messaging serves to hide the structural nature of racism.

Even more, colorblind racism tends to minimize racism itself and, when confronted with racial injustices, constructs and accepts elaborate race-based explanations for racial inequality. For example, within a color-blind racism frame, Latinx workers might be said to be paid less than White workers because they do not work as hard, are unreliable as workers, or are less qualified. And White workers are said to get more raises because they are smarter and work harder. With racial blinders on, anything that results from structural causes is explained by deficiency in the minoritized party, and coincidental superiority in the privileged party. This negates the structural origins of inequality and allows the status quo to continue.
In terms of the COVID-19 mortality rate, the sometimes spoken explanation (i.e. 1, 2, 3) is that Black people must be weak, prone to illness, or make unhealthy choices in general. That shift in focus, from talking about racial inequality in the mortality rate associated with a virus to, somehow, talking about Black people as deficient, weak, sick, and making poor choices, illustrates how color-blind racism is alive and well amidst this pandemic. Colorblind racism serves as a mask, preventing the public from seeing the structural causes of health disparities experienced by Black people and other people of color.

Election Day is right around the corner. In this #TSPClassic Collection, we review several oldies-but-goodies about voting and elections. These include pieces on historical and contemporary patterns in voter turnout,  and the evolution of voter laws in the USA.. We also take stock of how political participation and democracy itself goes beyond just voting on Election Day.

Who Votes and Why?

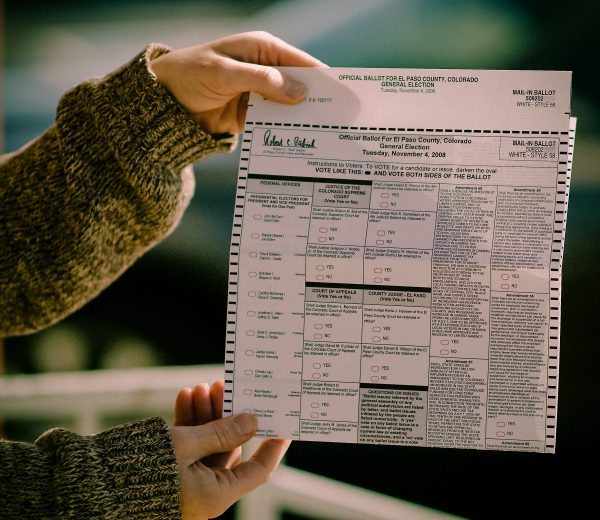
A woman holds up a ballot. Image via flickr, CCO.

Who people vote for, and why they vote for them, is an important element of studying elections and political participation in social science, That doesn’t mean you can convince everybody on the other side of the political aisle to vote for your preferred candidate. This Sociological Images post considers the growing field of cognitive sociology to explain why voter choice and voter preferences are complex and hard to change.

A common question in American politics is whether people will vote: what motivates some people to vote regularly in national and local elections versus others who don’t really vote at all? This Soc Images post describes the answers people give when asked why they didn’t vote? This can range from personal attitudes such as opinions about the candidates on the ticket and or a general disinterest in politics. A lack of voter turnout can also be explained by barriers in the process including registering to vote, finding time to vote, and even dealing with bad weather on Election Day. Importantly, voter patterns differ by demographics. As described by this Soc Images post and this TSP Special, there are clear differences in voter registration and turnout among people of varying races, education, gender, and other differing backgrounds. This research question has been studied at length for decades, and considering such findings over time reveals important trends. This post from Sociological images discusses how voter turnout has both grown and dipped over the 20th and early 21st centuries. 

Gender is an important element in studying voter patterns, turnout, and political impacts during election season. Indeed, the stories of radicalism, feminism, and the women’s suffrage movement were important historical moments when key ideas about democracy and equality developed. These ideas shape how we think about voting, identity, and activism today, as described in this Soc Images post. This is particularly relevant in recent decades as more female politicians are represented in major races and as social conversations, norms, and understandings of gender evolve. This Council on Contemporary Families post breaks down the nuts and bolts of gender, voting, and the 2016 election, which point to interesting directions for for future research down the road; how will gender shape the 2020 election?

Voting in the 21st Century: A New Era of Oppression?

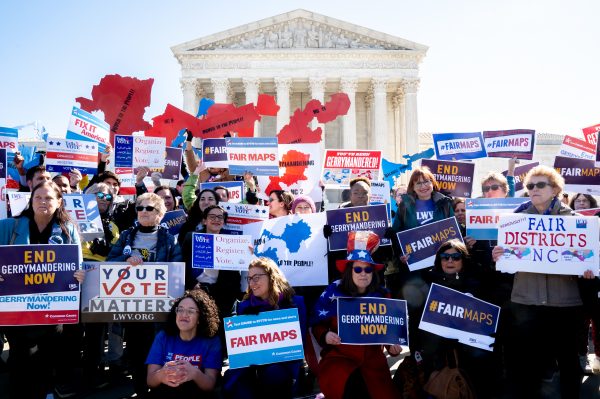
Protests against gerrymandering in front of the Supreme Court. Image via Flickr, CCO.

Voter suppression is on the rise in the USA, which is ironic given the prevalence of “Get Out the Vote!” messaging. Social scientists have investigated voter restriction laws, legislation, and policies implemented in the 2000’s and 2010’s  as a new chapter in America’s troubled history with voter suppression and voting right’s restriction. As described by this TSP Special, we’re over fifty years past the Voting Rights Act, yet voter suppression seems to be gaining momentum in recent years. History is indeed repeating itself as shown in this Soc Images post about voter suppression in the past and in the present.

Voter suppression can happen at the level of large locales or entire states. “Gerrymandering” is a process in which electoral maps are redrawn to favor one party over the others; the name is inspired by a salamander-shaped picture of a district which politicians had  redrawn so that voters from one region would cancel out others. Regardless of political affiliation or partisanship, we should all be concerned by the very real threat that Gerrymandering represents to our democracy, voting, and election outcomes, as explained by this TROT post and this Soc Images post.

One important dimension of voter suppression is felon disenfranchisement, wherein Americans convicted of a felony lose their right to vote. In recent decades, legislators have created new laws which expand the definition of felonious crimes; this has developed alongside other inequalities in policing, incarceration, and the criminal justice system. Thus, felon disenfranchisement represents an important product and driver of contemporary inequalities in the USA that unfold on racial and class lines, as described by several different #TSPClassics. TSP Editor Chris Uggen has been a major contributor to this area; his and colleagues’ research shows that millions of American votes have been lost to felon disenfranchisement, as discussed on The Sentencing Project.

Voter disenfranchisement has taken on a new face, as described in this post from Soc Images.  As Scholar Strategy Network explains, seemingly-innocent but problematic methods of voter suppression include the passage of voter ID laws and other individual requirements. These laws require voters to have financial resources and access to public institutions such as a local DMV. These requirements disproportionately affect racial minorities, the poor, the elderly, and other groups in the USA who already experience structural inequalities. Voter ID laws, as explained here by Soc Images, represent another chapter in voter suppression which thusly works to prevent people from accessing their right to vote.

Scholars in sociology and beyond have raised concerns about the recent growth of voter suppression and its consequences. Learn about the many dimensions of social science research on voter suppression from this post by Scholars Strategy Network’s research compendium. Voter suppression is a fundamental attack on the rights of citizenship and the pursuit of specific laws and rules that  make it harder to vote is often a targeted  strategy to prevent certain populations from voting. This post from Scholars Strategy Network presents research on politicians’ and policymakers’ attempts to suppress the vote of racial minorities.

Voter suppression has not waned in the twenty-first century. Most scholars agree that the problem has only gotten worse in  recent years. An important consequence of ongoing voter restriction is the distortion of the electorate. This means that rather than representing the general American population, the electorate is whiter and more conservative, as described by this Soc Images post. As described in this TROT post, the racial, class, and other inequalities heightened by voter suppression mean that gaps in who can vote have tangible, direct impacts on elections, politics, and policy.

“Democracy:” Elections and Beyond

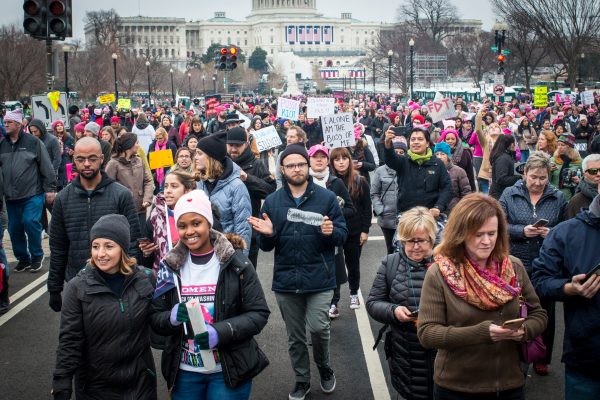
Image from the 2017 Women’s March in Washington, D.C. Image via Flickr, CCO.

Voting is a cornerstone of our democratic state and is the primary method by which the average citizen can impact politics. And yes, your vote matters!  This post from Sociological Images discusses how voting relates to public policy and how voter turnout predicts how public policies unfold. As described in this post from Cyborgology, elections and voting represent an important symbolic, social ritual for the fulfilment of democracy.This post from Feminist Reflections, aptly titled “When Women Roar,” considers gender in the 2016 election and politics as related to pop culture and equality in representation. 

Voting and election day can tell us a lot about our society; elections and voting are snapshots of social change and progress, as described by this TSP Special about the intersections of professional sports league, profits, and politics. We should remember, however, that being an involved citizen goes beyond Election Day. Social movements and activism are important parts of the democratic process and social change in a democracy, as described by this TSP Special. As we move forward, we should remember that voting is only one way to participate in democracy That being said, the right to vote–which some people take for  granted–has been increasingly restricted in recent years via several forms of voter suppression. We must continue  academic research and provide critical solutions to tackle this source of inequality and threat to our democracy.  We could also expand access to voting by modernizing   voter registration and voting as described in this post from SSN.  And, as many of us vote remotely during COVID, it’s important to reiterate that voter fraud is not a major issue in the USA, as described by this TSP Teaching post. Social science can help us move towards a future  with increased voting access and voter participation.

A shopping cart full of groceries viewed from above. Eddie Welker via flickr, CCO.

The Wall Street Journal recently interviewed Estefani Iraheta, a mother of two who requested donated food from her local Salvation Army when the pandemic hit. Every time she goes to pick up the canned food and staples, more people are waiting in line with her, seeking food for their families. As of August 2020, an estimated 12 percent of U.S. households, or roughly 1 in 8 U.S. households, did not have enough food within the last week; for U.S. households with children, nearly 20% stated they did not have enough food the previous week. 

Food insecurity refers to inconsistent access to sufficient, nutritious food that is necessary to live a healthy life. While hunger is a related issue, food insecurity is fundamentally about a lack of household resources. And the COVID-pandemic has worsened U.S. food insecurity by increasing unemployment, raising food prices, and closing schools. 

Schools are a vital institution, not only for learning but also for access to social services, including regular meals. From kindergarten to college, many schools offer a dependable source of community support and reliable access to food. Even before the pandemic, however, food insecurity has been a critical issue for U.S. students. In recent years, researchers have investigated how educational institutions handle this issue.
More recently, scholars have focused on the prevalence of food insecurity among college students, who are often viewed as a privileged group. In particular, research has devoted attention to how colleges do, or do not, address food insecurity.
Food insecurity is only one consequence of a larger societal issue: poverty and precarity in the United States. In 2019, approximately 34 million Americans were living in poverty, or 10% of the U.S. population. It’s important to recognize that poverty is structured not just by income, but by race, gender, citizenship, and other factors. Here are some key sociological resources on the experience of living poverty in the United States.

For more news coverage on food insecurity during the COVID-19 crisis in the United States, view The New York Times’ recent article and photo essay.

Covid-19 may be bringing long-term changes to workplaces and leisure activities as people become more attuned to potential infectious disease. But our shock, surprise, and general inability to deal with the virus also tells us something about how much our relationship with disease has changed. 

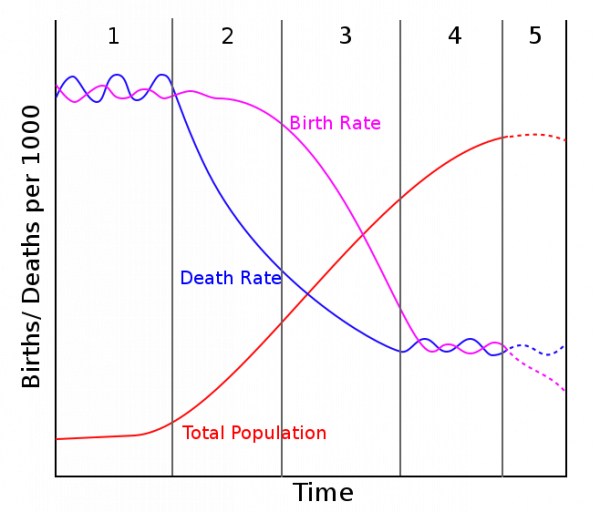
Graph showing the birth rates, death rate, and total population during each of the 5 stages of epidemiological transition. Image via Wikimedia Commons.

What scientists call the “epidemiological transition” has drastically increased the age of mortality. In other words, in the first two phases of the epidemiological transition lots of people died young, often of infection. Advancements in medicine and public health pushed the age of mortality back, and in later phases of the transition the biggest killers became degenerative diseases like heart disease and cancer. In phase four, our current phase, we have the technology to delay those degenerative diseases, and we occasionally fight emerging infections like AIDS or covid-19. Of course, local context matters, and although the general model above seems to fit the experience of many societies over a long period of time, it’s not deterministic. 

Inequality

Even before the epidemiological transition, not everyone had the same risk of contracting a deadly infection. Data from the urban U.S. shows that the level of mortality experienced by white Americans during the 1918 flu (a historic level considered to be a once-in-a-lifetime event by demographers), was the same level of mortality experienced by nonwhite Americans in every county in every year prior to 1918. 

Rise of new infectious diseases

Clearly, as we are seeing today, the epidemiological transition isn’t a smooth line. There is also considerable year-to-year and place-to-place variability, and new diseases can cause a sharp uptick in infectious disease deaths. For instance, the emergence of AIDS in the 1980s was responsible for a rise in infectious mortality and demonstrated the need to be prepared for new diseases. 

In just a few short weeks, covid-19 became a leading cause of death in the United States. The pandemic is a reminder that despite all of our health advances we aren’t beyond the disruptions of infectious disease, despite the broader long-term shift from high rates of childhood mortality to high rates of degenerative disease among elders.

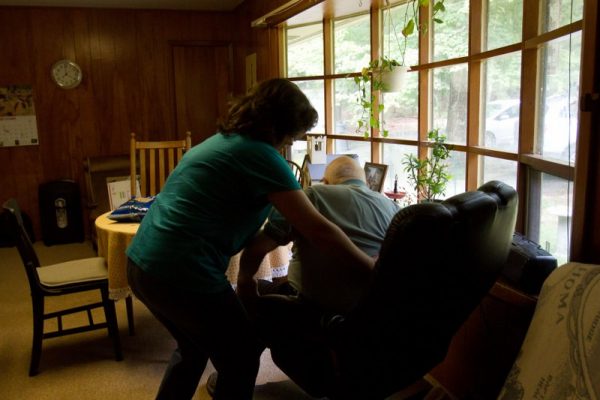
A woman helps an elderly man get up from his chair
Photo by Brian Walker, Flickr CC

When we talk about work, we often miss a type of work that is crucial to keeping the economy going and arguably more challenging and difficult than ever under conditions of quarantine and social distancing: care work. Care work includes both paid and unpaid services caring for children, the elderly, and those who are sick and disabled, including bathing, cooking, getting groceries, and cleaning.

Sociologists have found that caregiving that happens within families is not always viewed as work, yet it is a critical part of keeping the paid work sector running. Children need to eat and be bathed and clothed. Families need groceries. Houses need to be cleaned. As many schools in the United States are closed and employees are working from home, parents are having to navigate extended caring duties. Globally, women do most of this caring labor, even when they also work outside of the home. 
Photo of a woman cooking
Photo by spablab, Flickr CC
Globally, women do most of this caring labor, even when they also work outside of the home. Historically, wealthy white women were able to escape these caring duties by employing women of color to care for their children and households, from enslaved African Americans to domestic servants. Today people of color, immigrants, and those with little education are overrepresented in care work with the worst job conditions. 
In the past decade, the care work sector has grown substantially in the United States. However, care workers are still paid low wages and receive little to no benefits. In fact, care work wages are stagnant or declining, despite an overall rise in education levels for workers. Thus, many care workers — women especially — find themselves living in poverty.  

Caring is important for a society to function, yet care work — paid or unpaid — is still undervalued. In this time of COVID-19 where people are renegotiating how to live and work, attention to caring and appreciation for care work is more necessary than ever.

2020 is a census year in the United States, meaning that this year represents the major moment of a constitutionally-mandated survey about the American population.

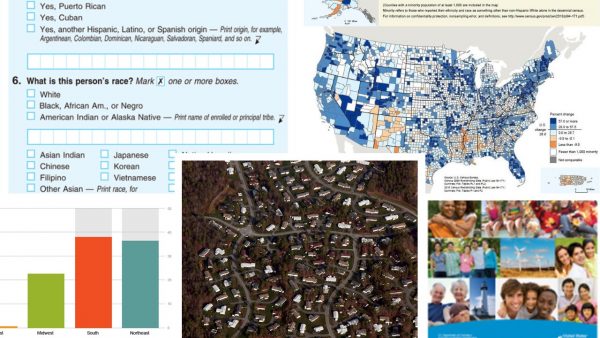
Since it was first introduced in the 18th century, the U.S. Census has always provided important data for guiding public policy and served as a crucial source of evidence for social science research. Considering we only get this chance once a decade, here at The Society Pages we took a quick census of our own content to bring you our favorites #TSPClassics about the Census. This collection covers a variety of topics, ranging from the nuts and bolts of conducting the Census itself, to how the history of the Census reflects and impacts changing racial and ethnic boundaries in the United States, and the variety of ways social scientists have used census data in conducting research and building theory. Read on!

The Census and Social Science: Lessons for and from Conducting Research

Advances in social science methodology and research have contributed to developments in the Census. Though it is a rare and large research endeavor unlike any other, the Census is a great example of theoretical and methodological considerations that social scientists grapple with every day. Not only does the Census give us a chance to put sociological theory and methodology into action, but Census data has been important in social science literature and research across a variety of fields.

As one of the largest endeavors in data collection, the Census has many complicated issues to consider as part of the practical processes involved with research and the interpretation of data.
  • In this #TSPClassic episode of Office Hours, we hear from Robert M Groves, a sociologist who was then Director of the Census Bureau, about how the Census manages and works through such complications.
  • In this Clipping, Robin Autry speaks with The Atlantic about how researchers clean census data to deal with ambiguous, fluid concepts such as race and ethnicity.
  • Then, read this #TSPClassic from The Color Line about the preparation and planning behind the 2010 Census; how does such thinking relate to the 2020 Census?
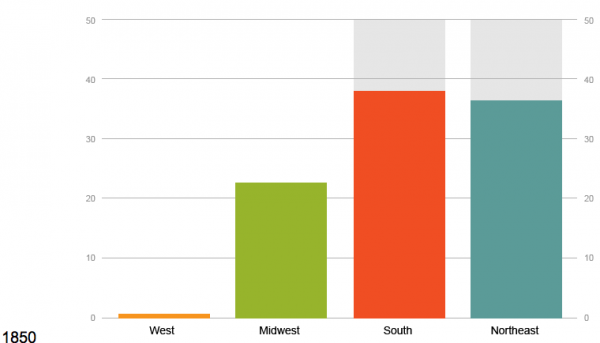
Bar graph with different colored lines shows U.S. regional distribution based on 1850 census. The northeast and south have the highest lines and are about the same. The west line is barely visible and the midwest line is in between.
Click to enlarge. Graph shows U.S. regional distribution based on the 1850 census, SocImages
Census data and related research can tell us a lot about our lives, particularly when it comes to where we live and how we work.
  • Scholars have used such data to understand the history of urbanization and suburbanization in the United States; this Sociological Images post draws on census data to visualize the development of the modern American metropolis and contemporary communities.
  • Read this Sociological Images post about inequalities in Americans’ commutes to work and access to transportation.
  • Finally, see how Graphic Sociology uses on census data to discuss how unemployment and poverty relates to age, gender, and much more. 
Photo shows a collage of pictures featuring people in groups. At the top, it says American Community Survey.
Photo via CCF
The Census can tell us a lot about the big picture, but what can it tell you about yourself?
  • In this article from Contexts, Leah Sabo reflects on how thinking about the Census can teach us about the individual and make us think about our own lives. Read on to spark your sociological imagination about privilege, neighborhoods, diversity, and much more.
The Census, and subsidiary projects it manages such as the American Community Survey (ACS), provide incredibly important data for social science research. Though the ACS reaches fewer people than the one-a-decade Census, it gathers information about ancestry, neighborhoods, and communities in more detail and with more regularity.
  • In this #TSPClassic from Council on Contemporary Families, Philip Cohen challenges proposed budget cuts to the ACS and explains why it is important to fund this survey and social science in general.
  • Furthermore, such research processes are important around the world; read a Sociological Images piece about what other censuses around the world look like, based on resources from the American Anthropological Association.

The Census and Race: The Social Construction of Race and Diversity in the USA

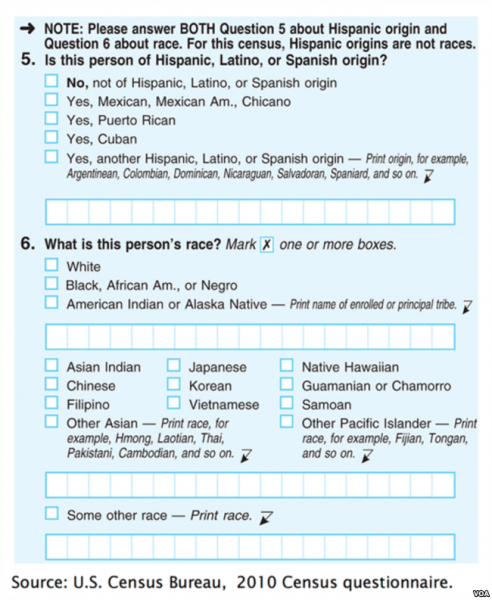
Photo shows a copy of the 2010 census questionnaire. The form is blue with check boxes and grids for the answers.
Click to enlarge. Photo via SocImages

“Race” is a social construction. Social forces shape how physical characteristics and groups become seen in racialized ways, and this happens through a variety of cultural and material processes. The ways the Census approaches race, ethnicity, and identity have changed drastically over its centuries-long history; much of this reflects shifting norms about racial categories and racism itself in the United States. Census data thus shows us how race and racial landscapes change, and the complexities of race in the United States.

Racial identification on the Census has changed and evolved.
  • This Sociological Images post describes how the Census’ racial categories have changed over the years
  • This Sociological Images post describes shifts in Census practices regarding the measurement of race through appearance versus identity. 
  • Be sure to read this summary of research on how the fluidity of racial identification on the Census can itself be a fluid process.
  • These next two Clippings consider how the Census relates to the intersections of race, ethnicity, nationality, and citizenship: the first describes how the Census affects the historical development of “Hispanic” as an ethnic category, and the second points to complexities in measuring American-Indian identities in census data. 
Census research has been used to study racial inequality both past and present.
  • This post from Sociological Images uses census data to illustrate discuss historical quantification of slavery.
  • And this #TSPClassic via Council on Contemporary Families draws on census data to discuss how, despite the passage of fifty years since the Civil Rights Act, racial inequality and disadvantage persist in a variety of outcomes.
  • Finally, read this Sociological Images post to learn more about racial residential segregation in several American metropolises.
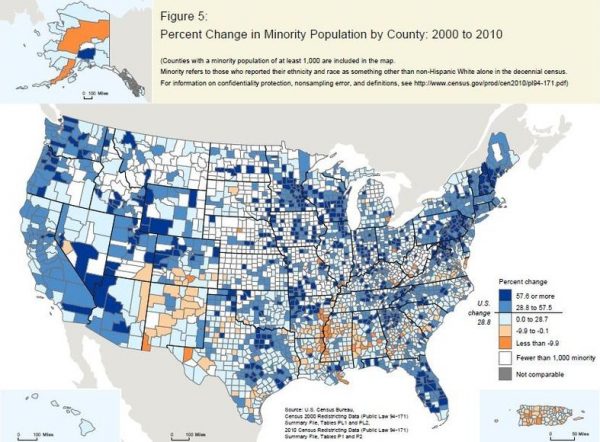
Image shows a color-coded map of the United States divided into counties. Each county's color is determined by the percent change in minority population by county from 2000 to 2010. The coasts look darker blue meaning there is more change.
Click to enlarge. Photo via SocImages
The twenty-first century has witnessed the rise of unprecedented racial and ethnic diversity in the United States.
  • This post from Council on Contemporary Families uses census data to capture how America’s children are growing up in a new era of everyday diversity
  • And this #TSPClassic from Sociological Images shows racial and ethnic diversity within American families.
  • This Sociological Images post considers potential contrasts between the demographics of the mid-20th and the mid-21st century.
  • Along these lines, read this post from Color Lines about the rise of interracial marriage and families, particularly for Asian-Americans. 
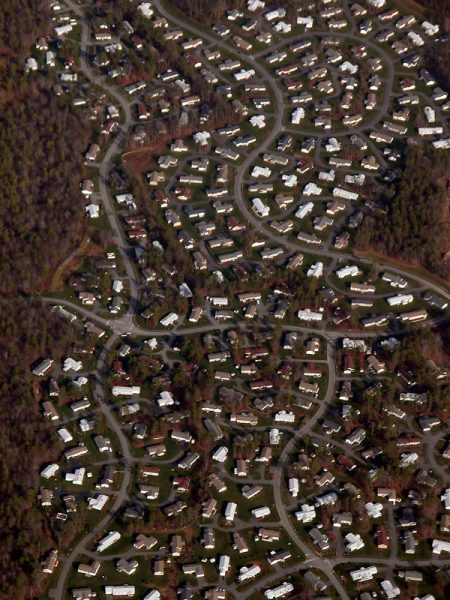
Image shows an aerial  view of a suburban community.
Photo by Art01852, Flickr CC
The rise of difference and diversity has drawn discomfort, racial tensions, and backlash, and much of this comes from the ways that everyday people react to census data and population projects.
  • This Clipping describes such reactions
  • And this Clipping describes how census data can be used to stoke fears about immigration.
  • Finally, be sure to read this #TSPClassic, a special feature about the “whitelash” against diversity.
As American diversity continues to rise, push back and resentment will surely continue to be relevant to how people use and react to census data. What will we see once the 2020 numbers come out?
Finally, it is important to recognize that rising racial diversity does not necessarily mean that racial inequality will disappear; in fact, sociologists often find the opposite. One such area of research is related to segregation and concentrated disadvantage, wherein non-white communities often have less cultural, political, and economic power.
  • Be sure to read this Discoveries post about historical and contemporary racial segregation between the North and the South,
  • And read this Clippings piece about how segregation persists despite an increasingly racially diverse population. 
As we move into a future of greater difference, such ideas are important to keep in mind; what will the 2020 Census tell us about race, diversity, and inequality?

We hope you enjoy these #TSPClassics as much as we do, and we look forward to working with the 2020 Census data!

A young girl blows out a birthday candle with help from her grandmother and brother. In times of economic recession, many individuals experiencing hardship receive help from extended family members. Photo via Wallpaper Flare.

A few weeks ago, the Dow Jones fell 20% from its high. To many this is an indicator of great uncertainty about the future of the market and could be an indication of a coming recession. And this was even before the crisis of COVID-19. In these uncertain economic times, we look back to how the Great Recession of 2008 impacted families’ decision-making including whether or not to have children, where to live, and how much to rely on family members for financial support. Perhaps this recent history can help us imagine what might lie ahead.

Demographers and other social scientists are interested in the fertility rate, or the number of live births over the lifetime of a child-bearing woman. After the Great Recession, the fertility rate fell to below replacement rate (or 2 children per every one woman) for the first time since 1987. Scholars attribute this change in fertility to increased economic uncertainty; people do not feel confident about having a child if they are not sure what will come next. In fact, the fertility rate fell lowest in states with the most uncertainty, those hit hardest by the recession and “red states” concerned about the economic future under Obama.
  • Schneider, Daniel. 2015. “The Great Recession, Fertility, and Uncertainty: Evidence From the United States.” Journal of Marriage and Family 77(5):1144–56.
  • Guzzo, Karen Benjamin, and Sarah R. Hayford. 2020. “Pathways to Parenthood in Social and Family Contexts: Decade in Review, 2020.” Journal of Marriage and Family 82(1):117–44.
  • Sobotka, Tomáš, Vegard Skirbekk, and Dimiter Philipov. 2011. “Economic Recession and Fertility in the Developed World.” Population and Development Review 37(2):267–306.
During the Great Recession there was also an increase in the number of young adults, both single and married, living with their parents. Rates of both young married adults living with their parents increased in 2006 to reach 1900 levels which is surprising considering that the century between 1900 and 2000 is considered the “age of independence,” when many more young people moved out and established households of their own. This effect was particularly strong for young adults with less education and those who had fewer resources to weather the storm of the recession on their own.
The economic challenges of the late 2000s also may have led to an increase in interpersonal conflict within families. In part, this may stem from the pressure family members feel to serve as a safety net for relatives who are struggling financially. For instance, Jennifer Sherman found that some individuals who were experiencing financial hardship withdrew from their extended family during the Great Recession rather than asking for support. This, along with findings that giving money to family members during the recession increased an individual’s chance of experiencing their own financial stress, raises questions about whether or not family networks can offer support in times of economic turmoil.
  • Sherman, Jennifer. 2013. “Surviving the Great Recession: Growing Need and the Stigmatized Safety Net.” Social Problems 60(4):409–32.
  • Pilkauskas, Natasha V., Colin Campbell, and Christopher Wimer. 2017. “Giving Unto Others: Private Financial Transfers and Hardship Among Families With Children.” Journal of Marriage and Family 79(3):705–22.
As the economic effects of covid-19 are felt across the country, many Americans are preparing for another severe economic downturn. Understanding how the Great Recession influenced family structure and life is an important lens for considering how large economic events shape people’s everyday lived experiences.
Flyers at Hartsfield-Jackson Atlanta International Airport wearing facemasks. Photo by Chad Davis, Flickr CC

During times of crisis, existing prejudices often become heightened. Fears about the current coronavirus, or COVID-19, have revealed rampant racism and xenophobia against Asians. Anti-Asian discrimination ranges from avoiding Chinese businesses to direct bullying and assaults of people perceived to be Asian. This discriminatory behavior is nothing new. The United States has a long history of blaming marginalized groups when it comes to infectious disease, from Irish immigrants blamed for carrying typhus to “promiscuous women” for spreading sexually transmitted infections. 

Historically, the Chinese faced blame time and again. In the 19th century, public health officials depicted Chinese immigrants as “filthy,” carriers of disease. These views influenced Anti-Chinese policies and practices, including humiliating medical examinations at Angel Island — the entry port for many Chinese immigrants coming to America — and the violent quarantine and disinfection of San Francisco’s Chinatown in the early 20th century when a case of the Bubonic plague was confirmed there. 
An advertisement for "Rough on Rats" rat poison. On the flyer there is an image of a stereotypically drawn "china man" eating a rat.
Late 19th century racist advertisement for rat poison

Discrimination against the Chinese is one example among many. Such discrimination had nothing to do with their actual hygiene and health, and everything to do with their social position relative to other racial groups. It’s easy to look back on the xenophobic U.S. policies and behavior in earlier times. Let’s not fall into the same patterns today.

For more on xenophobia and coronavirus, listen to Erika Lee on a recent episode of NPR’s podcast, Code Switch.

Many stacks of textbooks. Photo via Pixabay.

Textbooks are more prevalent in American history courses than in any other subject, and a recent article from The New York Times revealed how geography has influenced what U.S. students learn. Despite having the same publisher, textbooks in California and Texas (the two largest markets for textbooks in the U.S.) vary wildly in educational content. Researchers have also found numerous inconsistencies and inaccuracies in American history textbooks, resulting in the glorification of national figures and spread of national myths.

Depictions of violence in textbooks are also highly politicized. Episodes of violence are often muted or emphasized, based on a country’s role in the conflict. For example, conflicts with foreign groups or countries are more likely than internal conflicts to appear in textbooks. Additionally, American textbooks consistently fail to acknowledge non-American casualties in their depictions of war, citing American soldiers as victims, rather than perpetrators of the horrors of war. Depictions of conflicts also vary over time, and as time passes, textbooks move away from nationalistic narratives to focus instead on individualistic narratives.
Public figures, like Hellen Keller and Abraham Lincoln, tend to be “heroified” in American textbooks. Rather than treating these public figures as flawed individuals who have accomplished great things, American textbooks whitewash their personal histories. For example, textbooks overlook Keller’s fight for socialism and support of the USSR and Lincoln’s racist beliefs. The heroification of these figures is meant to inspire the myth of the American Dream — that if you work hard, you can achieve anything, despite humble beginnings.
Symbolic representation of the past is important in stratified societies because it affects how individuals think about their society. Emphasizing the achievements of individuals with humble beginnings promotes the belief among American students that if they work hard they can achieve their goals, despite overwhelming structural inequalities. Furthermore, as historical knowledge is passed down from one generation to the next, this knowledge becomes institutionalized and reified–making it more difficult to challenge or question.
Cartoon. Six blind men touch different parts of an elephant and each has a different idea of what the elephant is based on what they've touched

This post was created in collaboration with the Minnesota Journalism Center

Objectivity and neutrality have been cornerstone norms of journalistic practice in democracies in the Western world for over a century. However, in recent years ideals of fairness, accuracy, and balance have come under increasing attack from many different and sometimes unexpected directions. 

Many beliefs about the need for media objectivity go back to Alexis de Tocqueville’s 19th century argument that the circulation of newspapers are integral to fostering a functional and effective democracy. Indeed, objectivity became a news value in the 1830s, partly to do with the rise of the Associated Press (AP), created in 1848 by a group of New York newspapers that wanted to take advantage of the speed of the telegraph in transmitting news to multiple outlets. To transmit news to a variety of news outlets with a variety of political allegiances consistently, a sense of objectivity had to be maintained to be relevant to as wide an audience and clientele as possible. 
Cutting against these norms was the sensationalism of newspaper content in the late 19th century. While the use of emotion in reporting has often been connected to the commercialization and tabloidization of journalism, in recent years it has also appeared in coverage of disasters, crises, and human rights abuses — and has come to be seen as positive and valuable as well. The roles of objectivity and impartiality have always been contested within journalistic practice, so rather than seeing emotion as the opposite of objectivity, some scholars now argue it can come alongside and inform journalistic practice worldwide.
The role of objectivity has also come into question as a mechanism that can silence marginalized writers and populations. Relatedly, news can also reinforce institutions of power in society, for better or for worse. In populist countries including Argentina, Bolivia, Ecuador, Nicaragua, and Venezuela, “professional journalism” is often pitted against “militant journalism” promoted by neo-populist governments and their sympathizers — a movement that has critical implications for the freedom of the press in societies in the Global South. Also, news media has been found to negatively portray protests and protesters.