
People often think of social change in the lives of American children since the 1950s as a movement in one direction – from children being raised in married, male-breadwinner families to a new norm of children being raised by working mothers, many of them unmarried. Instead, we can better understand this transformation as an explosion of diversity, a fanning out from a compact center along many different pathways.
The dramatic rearrangement of children’s living situations since the 1950s
At the end of the 1950s, if you chose 100 children under age 15 to represent all children, 65 would have been living in a family with married parents, with the father employed and the mother out of the labor force. Only 18 would have had married parents who were both employed. As for other types of family arrangements, you would find only one child in every 350 living with a never-married mother!
Today, among 100 representative children, just 22 live in a married male-breadwinner family, compared to 23 living with a single mother (only half of whom have ever been married). Seven out of every 100 live with a parent who cohabits with an unmarried partner (a category too rare for the Census Bureau to consider counting in 1960) and six with either a single father (3) or with grandparents but no parents (3).The single largest group of children – 34 – live with dual-earner married parents, but that largest group is only a third of the total, so that it is really impossible to point to a “typical” family.
With two-thirds of children being raised in male-breadwinner, married-couple families, it is understandable that people from the early 1960s considered such families to be the norm.* Today, by contrast, there is no single family arrangement that encompasses the majority of children.
The figure below illustrates this fanning out from a dominant category to a veritable peacock’s tail of work-family arrangements.
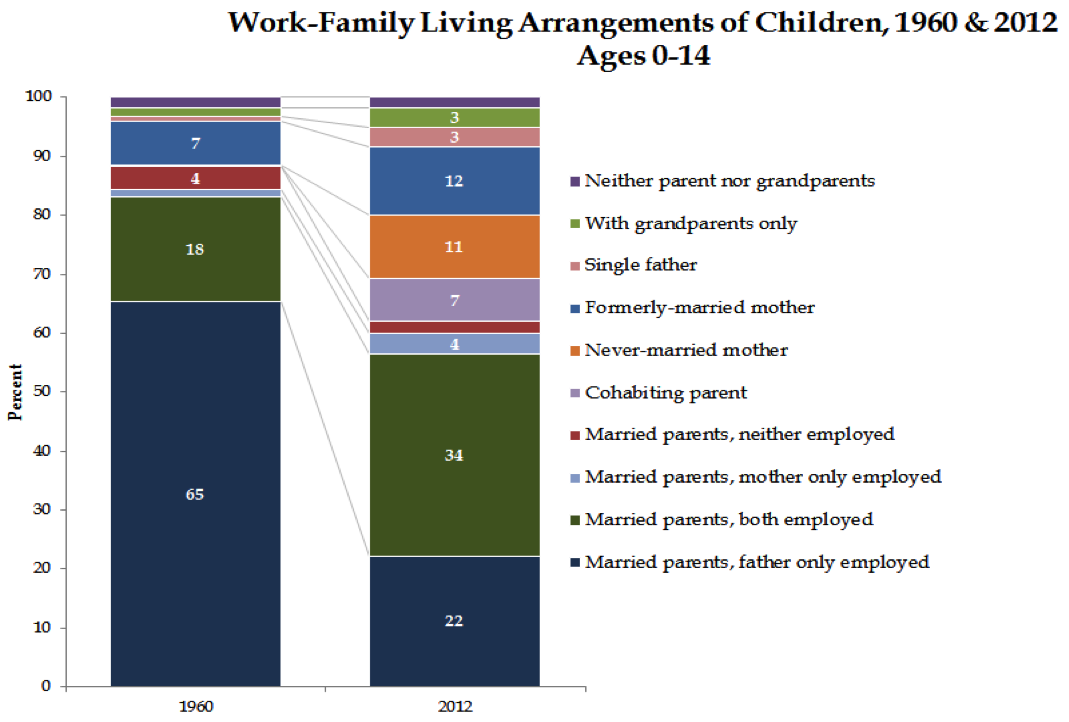
To represent this diversity simply, we can calculate the chance that two children live in the same work-family structure (among the categories shown here). In 1960 you would have had an 80 percent chance that two children, selected at random, would share the same situation. By 2012, that chance had fallen to just a little more than 50-50.
The diversity shown here masks an additional layer of differences, which come from the expanding variety of pathways in and out of these arrangements, or transitions from one to another. For example, among the children living with cohabiting parents in 2012, the resident parent is divorced or separated in about a third of cases. In those cases, the cohabiting-parent family often is a blended family with complex relationships to adults and children outside the household. Many more parents have (or raise) children with more than one partner over their lives than in the past, and many more children cycle through several different family arrangements as they grow up.
The children in America’s classrooms today come from so many distinct family arrangements that we can no longer assume they share the same experiences and have the same needs. Likewise, policy-makers can no longer design family programs and regulations for a narrow range of family types and assume that they will pretty much meet the needs of all children.
The decline of married couples as the dominant household arrangement
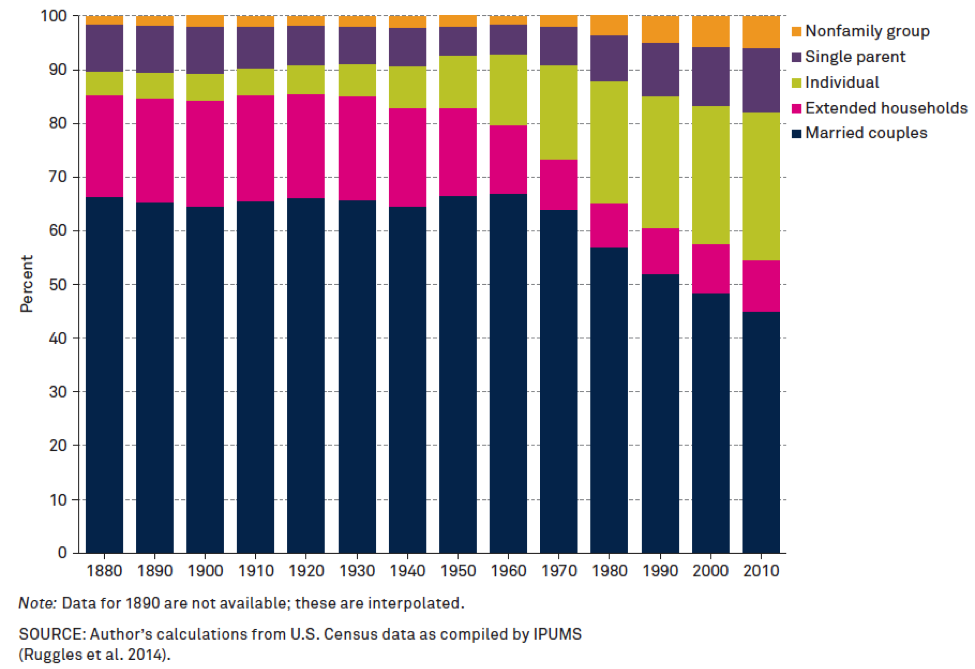
The diversification of family life over time is also shown in the changing proportions of all household types, including ones without children. In the next figure I put each household into one of five types, using Census data from 1880 to 2010. The largest category is households composed of married couples living with no one except their own children. If there was any other relative living in a household, I counted it as an extended household. The third category is individuals who live alone. Fourth are single parents (most of them mothers) living with no one besides their own children. In the final category are households made up of people who are not related (including unmarried couples).
As this figure shows, the married-couple family peaked between 1950 and 1960, when this arrangement characterized two-thirds of households. This was also the peak of the nuclear family, because up until the 1940s, extended families were much more common than they became in the 1950s and 1960s. After that era, the pattern fans out.
By 2010, the proportion of married-couple households had dropped to less than half (45 percent) of the total. The proportion of individuals living alone rose from 13 to 27 percent between 1960 and 2010, and single-parent households rose from 6 to 12 percent. The result is that households composed of lone individuals and single parents accounted for almost 40 percent of all households by 2010. Extended households are less common than they were a century ago, mostly as a result of the greater independence of older people, but their numbers have increased again in the last several decades. In sum, the dominant married-couple household of the first half of the twentieth century was replaced not by a new standard, but rather by a general increase in family diversity.
How did we get here? Market forces, social welfare reform, and family rearrangements
As the market economy generated new products and services that can supplement or substitute for many of the core functional tasks that families had to perform in the past, people became more able to rearrange their family lives. For example, technological innovations made women’s traditional household tasks, such as shopping, preserving food, house-cleaning, and making clothes, far less time-consuming, while better birth control technology allowed them to control the timing or number of their births. After 1960, employment rates for both married and unmarried women rocketed upward in a 30-year burst that would finally move women’s work primarily from the home to the market.
The shift to market work reinforced women’s independence within their families, but also, in many cases, from their families. Women freed from family dependence could live singly, even with children; they could afford to risk divorce; and they could live with a man without the commitment of marriage.
In the aftermath of the Depression and World War II, social reformers increased their efforts to provide a social safety net for the elderly, the poor, and the disabled. The combination of pension and welfare programs that resulted also offered opportunities for more people to structure their lives independently.
For older Americans, Social Security benefits were critical. They helped reduce the effective poverty rates of older people from almost 60 percent in the 1960s to 15 percent by 2010, freeing millions of Americans from the need to live with their children in old age. At the beginning of the twentieth century, the Census counted only 1 in 10 people age 55 or older living with no relative. By the end of the century, the proportion was more than 1 in 4. Most of that change occurred between 1940 and 1980.
For younger adults, the combination of expanding work opportunities for women and greater welfare support for children made marriage less of a necessity. In the 1960s and 1970s, Aid to Families with Dependent Children grew rapidly, eventually supporting millions of never-married mothers and their children. Welfare did not create single-mothers – whose numbers rose partly in response to poverty, economic insecurity, and rising incarceration rates, and have continued to rise even after large cutbacks in public assistance– and it always carried a shameful stigma while providing a minimal level of monetary support. But it nevertheless allowed poor women to more easily leave abusive or dangerous relationships.
Market forces were most important in increasing the ability of middle-class and more highly educated women to delay, forego, or leave marriage. Poor women, especially African-American women, had long been more likely to work for pay, but their lower earnings did not offer the same personal independence that those with better jobs enjoyed, so welfare support was a bigger factor in the growing ability of poor women to live on their own. Nevertheless, the market has contributed to the growth of single mother families in a different way over the past 40 years, as falling real wages and increasing job insecurity for less-educated men have made them more risky as potential marriage partners.
As a result of these and other social trends such as women’s increasing educational attainment, diversity of family arrangements increased dramatically after the 1950s.
Changes in women’s work-family situations
The work-family situations of both women and children show the same pattern of increasing diversity replacing the dominant-category system that peaked in the 1950s. The next two figures describe women aged 30-34. The rise in education and employment is most dramatic, while marriage and motherhood have become markedly less universal.
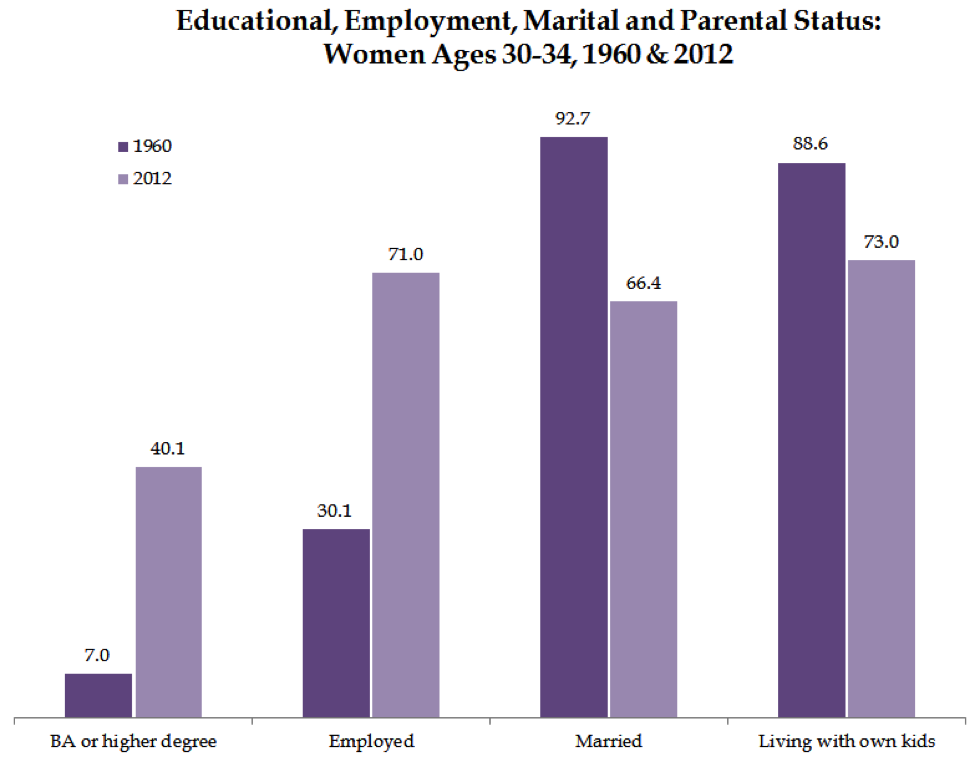
Rather than simply see each of these as separate trends, we can create profiles by combining the four characteristics into 16 different categories – employed college graduates who are married mothers on one extreme; non-employed non-graduates who aren’t married or mothers on the other. In the final figure, I show the distribution across the 10 most common of these. These clearly show the decline in a single profile – the married, non-college educated, not-employed, mother – and the diversity in statuses that have replaced that single type.
In 1960, almost 80 percent of women in their early 30s and had not completed college and were married with children. Now such women comprise less than a third of the total – and no category includes more than 18 percent of women. In terms of diversity, in 1960 the chance that two women picked at random would be from from the same category was 40 percent. Today that chance has fallen to 11 percent.

Diversity and inequality
Some of the new diversity in work-family arrangements is a result of new options for individuals, especially women and older people, whose lives are less constrained than they once were. But some of the new diversity also results from economic changes that are less positive, especially the job loss and wage declines for younger, less-educated men since the late 1970s.
In and of itself, however, family diversity doesn’t have to lead to inequality. In the Nordic countries of Finland, Norway and Denmark, for example, unmarried-mother families have poverty rates that barely differ from those of married-couple families – all have poverty rates less than 10 percent. Similarly, many countries do a better job of minimizing the school achievement gap between children of single mothers versus children of married parents – a study of 11 wealthy countries found the gap is largest in the United States.
Different families have different child-rearing challenges and needs, which means we are no longer well-served by policies that assume most children will be raised by married-couple families, especially ones where the mother stays home throughout the children’s early years. As we debate social and economic policy, we need to consider the needs of children in many different family situations, and how they will be affected by policy changes, rather than privileging one particular family structure or arrangement.
***
For further information, contact Professor Cohen at pnc@umd.edu; (301) 405-6414. Most of the charts above were prepared especially for this paper, but much of the data can also be found in Professor Cohen’s new book, The Family: Diversity, Inequality, and Social Change, available now from W.W.Norton: http://books.wwnorton.com/books/978-0-393-93395-6/.
*Interestingly, the dominance of the male breadwinner nuclear family was not always as great as it was at mid-century. As historian Stephanie Coontz has shown, up until the 1920s, most households contained more than one wage earner – mothers working on the family farm or business, and/or children working for pay as well.
Comments 1
To know poverty proportions, know your terms (Fox News edition) | Family Inequality — September 24, 2014
[…] report I provided to the Fox staff had actually shown that one-third — not two-thirds — of […]