
Cross-posted at Montclair SocioBlog.
In a democracy, all votes are created equal — one person, one vote -– but apparently some votes are more equal than others. Obama won the electoral college vote 62% – 38%, though his margin in the popular vote was much smaller: 51% – 48%.
A similar discrepancy happened in the vote for Congressional representatives. The Republicans control the House of Representatives, where they have 54% of the seats. But if you add up all the votes for those seats, the Democrats come out slightly ahead (by about 500,000 votes). More votes but fewer seats.
That discrepancy arises from the distribution of Democrats and Republicans in a state’s Congressional districts. Take a hypothetical state with four districts, each with 200 people. The popular vote splits evenly –- 400 Democrats, 400 Republicans. Here are the election results:
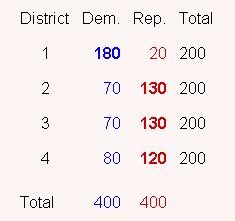
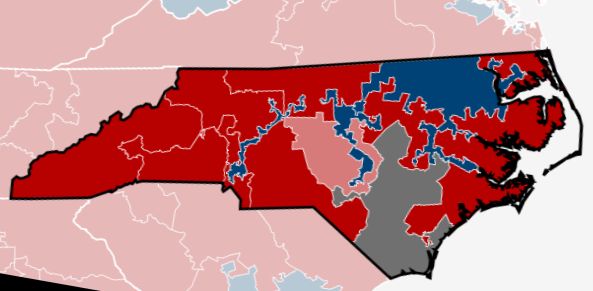
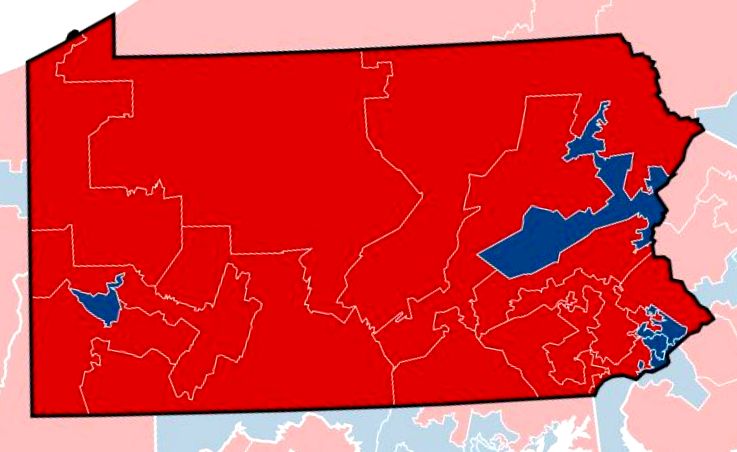
My first thought was that this was pure Gerrymandering. State legislatures get to draw the maps of their Congressional districts. And many more state legislatures are controlled by Republicans. In fact, some of the North Carolina districts have unusual shapes. The NC-12, the thin blue line along Interstate 85 stretching nearly to the border, was created as a “majority-minority” district so that Black votes would not be diluted. The downside for Democrats is that it packs those votes into that narrow corridor. So the Democrats take that district by over 180,000 votes. The Republicans with the neighboring districts but by much smaller margins – 23,000, 25,000, and 53,000. In those four districts, the Democrats got 53% of the vote, but Republicans took three of the four seats.
The Democratic district snaking down through the middle of the state is the 4th, which contains “the Triangle” to the north, but now has that tail stretching down. Democrats carried the district by 170,000 votes. Surrounding it is the 2nd (in pink), which Republicans carried by only 45,000 votes.
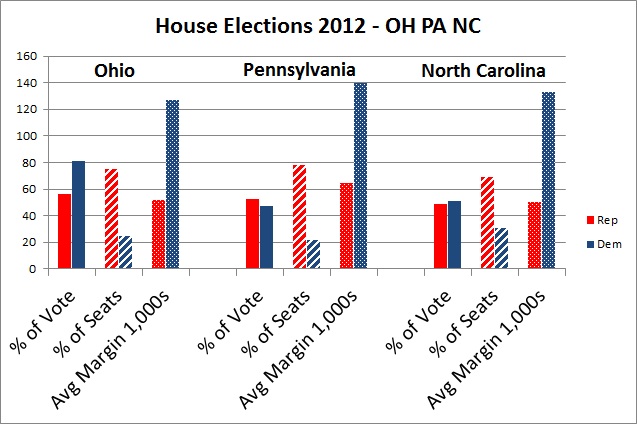
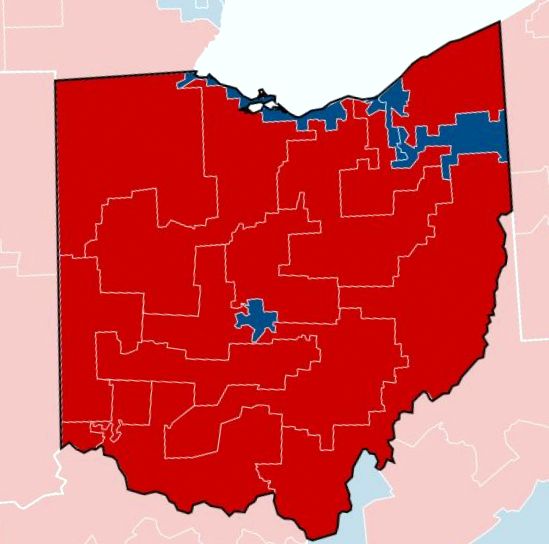
Similar differences crop up in Ohio and Pennsylvania. The popular vote is close, and in two of these states it goes to the Democrats. But Republicans get most of the seats. Republicans win their seats by less than half the margin of Democratic winners. Here is a graph of the actual returns from Ohio, Pennsylvania, and North Carolina. (The Ohio total does not include the vote from the two uncontested districts, one Democrat, one Republican. For the maps and election results, check out Politico.)
I don’t know enough about the demography and geography of these states, but I do wonder why the districts are drawn this way. A paper by Chen and Rodd (here) that uses 2000 election data argues that what looks like gerrymandering is in fact the result of “human geography.” It’s not the legislatures that pack Democrats together, it’s the Democrats themselves. They cluster in cities. As for Democrats outside of cities,
many rural, small-town, and suburban precincts that lean Democratic are often subsumed into moderately Republican districts. . . . There are isolated pockets of support for Democrats in African-American enclaves in the suburbs of big cities and in smaller towns with a history of railroad industrialization or universities. However, these Democratic pockets are generally surrounded by Republican majorities, thus wasting these Democratic votes. As a result, the Democrats are poorly situated to win districts outside of the urban core.
Regardless of intent, the effect is to keep Democratic votes concentrated in the 4th. If that blue tail of the NC-04 were subsumed into the pink NC-02, both districts might be blue.
In any case, Democrats have not always been on the wrong side of the seat/vote discrepancy. John Sides at The Monkey Cage posted this graph showing the ratio for the last twenty-six elections.
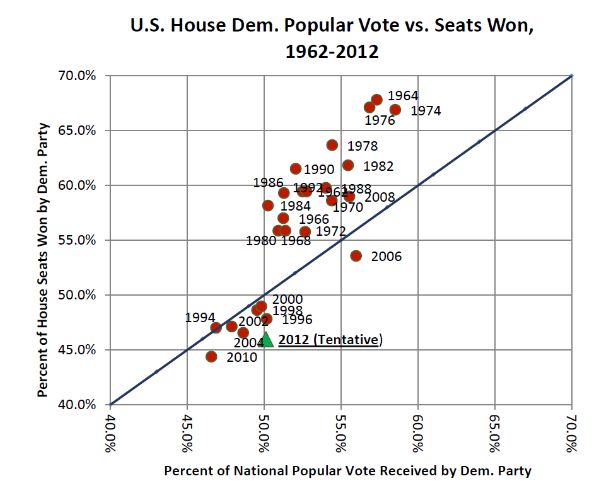
Sides quotes Matthew Green on the general trends:
- the winning party usually gets a “boost” in the number of seats
- that boost used to be much larger
That trend might fit with the deliberate-gerrymander explanation, provided that in the earlier decades more state legislatures were controlled by Democrats. But I’m not sure how it fits with Chen and Rodden’s human geography idea of “unintentional gerrymandering.”
—————————
Jay Livingston is the chair of the Sociology Department at Montclair State University. You can follow him at Montclair SocioBlog or on Twitter.
Jay Livingston is the chair of the Sociology Department at Montclair State University. You can follow him at Montclair SocioBlog or on Twitter.
Comments 27
Orion Adrian — November 13, 2012
Yes, several the democratic districts are majority-minority districts. Overall I've been pretty outraged by the Gerrymandering in our state.
Orion Adrian
Raleigh, NC
Mae Spires — November 13, 2012
This is a pretty fun little way to learn more about gerrymandering: http://www.redistrictinggame.org/
LynneSkysong — November 13, 2012
I live near the Dayton area in Ohio. Since the big cities (Columbus, Akron, and Cleveland) are usually go to the Democrats, I was wondering why Dayton didn't too... but as I look at the map, it looks like Dayton is split up into 4 sections, with a lot of rural (and most Republican) voters. Divide and conquer? It makes me wonder.
oliviacw — November 13, 2012
Intuitively, congressional districts should be compact and contiguous, following existing political boundaries and natural geographical features. It's amazing how far away from that philosophy you can get if you are driven by pure partisan politics.
Yuuki — November 13, 2012
For ignorant like me this video does a nice job explaining gerrymandering and other problems with elective systems:
http://www.youtube.com/watch?feature=player_embedded&v=s7tWHJfhiyo
nydwracu — November 13, 2012
In the wake of the 2012 election, gerrymandering has been covered with mostly Republican anecdotes, sometimes explicitly saying that gerrymandering is a Republican problem. It should be noted that it isn't; gerrymandering is a natural result of the American system of districts.
The Maryland district map is an excellent example of gerrymandering on the other side of the aisle; and, unlike with the districts here, it's completely implausible that the intent of the recent redistricting was to provide racial minorities with Congressional representation, since it extended the district that previously covered the rural, white, Republican counties in Western Maryland into parts of suburban, white, Democratic Montgomery County in order to get Roscoe Bartlett replaced with a Democrat.
Yrro Simyarin — November 14, 2012
I always wonder what actually leads to better representation... living somewhere where 40% of the electorate did not approve of their representative, but there is a small chance that they might next time, or living somewhere where only 10% disapprove of their representative, but have no chance of replacing them.
In the second case they are a truer representative of the people, but in the first they have at least some incentive to consider pandering to bother sides.
guest — November 14, 2012
oh yeah well what are you gonna do about it
Umlud — November 15, 2012
One more example showing how different the proportions of the popular vote against the proportions of seats won:
http://andrewsullivan.thedailybeast.com/2012/11/chart-of-the-day-7.html
decius — November 16, 2012
Perfect districting would grant all of the seats to the party with a simple majority (assuming that the party candidates all follow the party line).
That would be 51% of the vote yields 100% of the seats.
Anything less than that is evidence that gerrymandering is not taking place.
Fredia Washing — December 21, 2020
Secara awam dalam tipe beton ready mix ini tak ada perbedaannya, cuma brand dan pengambilan beton dari batching plantnya saja yang berbeda, secara ... selengkapnya https://roadbarriermegacon.kedungsepur.my.id/2020/09/harga-road-barrier-megacon-1-di_8.html
Corey Schleuder — December 21, 2020
Phenolic board yaitu Panel Partisi WC yang kamar kecil dari yaitu lapis Kraft paper dan resin yang dilaminasi sebagian dengan decorative paper pada ... kunjungi https://showerbox.jabodetabek.my.id/2020/09/jual-shower-box-makasar-jakarta-timur-1.html untuk informasi selengkapnya.
Becky Sowada — December 29, 2020
Jasa Kontraktor Kolam Renang, Perawatan dan Renovasi. Banyak Pilihan Desain. Pengerjaan Relatif Cepat. Material Berkwalitas. Melayani Seluruh Indonesia ... lihat https://perawatan-kolamrenang.netlify.app/perawatan-kolam-renang-kupang.html untuk peroleh promo terbaik
Jed Divincenzo — January 6, 2021
Car towing service around 15 miles · Ditch extraction service (Some restrictions apply.) · Delivering gas as soon as your tank is empty. (Some restrictions apply.) · Jump ... tap https://carcarrier.netlify.app/car-carrier-surabaya-yogyakarta.html for detail
Leonel Zurheide — January 8, 2021
Kaca tempered merupakan material yang banyak dipakai pada rumah minimalis modern sebab memiliki banyak kelebihan. Apa saja sih, info lebih detail https://railing-kaca-murah.blogspot.com/2019/12/jual-railing-kaca-tempered-1-cilegon.html
Enid Hawking — January 18, 2021
Epoxy is a mass and heat painful and sensitive material. The gel time (time it requires the combined epoxy resin and hardener to originally harden up) may vary drastically relying on... click https://floorhardener.jabodetabek.my.id/ for detail.
Ayanna Sails — January 25, 2021
DistributorPintu.com, the top company associated with superior good quality door products. By using several years experience of developing and even doing, click https://pembuatanpintuflush.blogspot.com/2020/08/jual-pintu-flush-1-tasikmalaya-0812.html for more info.
Yong Fulks — September 16, 2022
Executive Education relies on a personalized learning method, one student one teacher, competitive private tutoring fees (cheap), flexible time ... click for more information https://matematika-exed.blogspot.com/2022/04/les-privat-matematika-terdekat-di_3.html
Devona Elgart — October 24, 2022
Institutional Executive-Education.id is often a Jabodetabek private tutoring support that may be well guided by simply encountered instructors to all topic areas of expertise lessons in any respect quantities ... go to https://kursus-ekonomi.netlify.app/les-privat-ekonomi-jakarta-barat.html for more details
Bebe Sovel — December 1, 2022
Are you wanting tutoring services or private lessons while in the Greater Jakarta area as well as its surroundings? Searching for private tutoring services... visit https://kursus-mandarin.vercel.app/kursus-bahasa-mandarin-tanah-abang.html for more information
Andre Lafauci — December 7, 2022
Executive-Education.id is a private teacher provider site in Jabodetabek that is able to help parents to seek out tutors for their kids according to their wishes... go to https://privat-matematika.vercel.app/les-privat-matematika-jakarta-selatan.html for more details
Tanya Williamson — May 26, 2023
Ignite your desire for languages and join our immersive language program at Executive-Education.id. Having a give attention to practical communication skills, authentic materials, and real-world scenarios, you'll build fluency and confidence in your preferred language. Get hired to play a world of linguistic excellence and start on a journey of non-public and professional growth. Click https://kursus-korea.github.io/kursus-bahasa-korea-cilincing.html for latest information.