
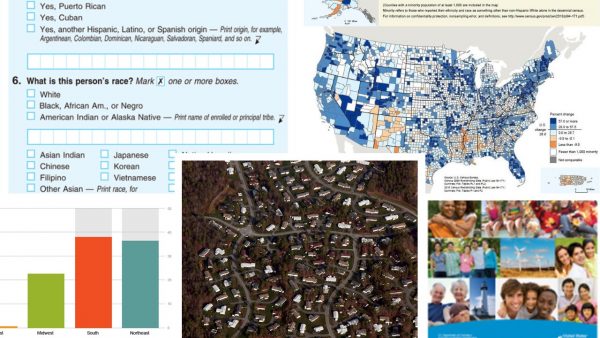
2020 is a census year in the United States, meaning that this year represents the major moment of a constitutionally-mandated survey about the American population.
Since it was first introduced in the 18th century, the U.S. Census has always provided important data for guiding public policy and served as a crucial source of evidence for social science research. Considering we only get this chance once a decade, here at The Society Pages we took a quick census of our own content to bring you our favorites #TSPClassics about the Census. This collection covers a variety of topics, ranging from the nuts and bolts of conducting the Census itself, to how the history of the Census reflects and impacts changing racial and ethnic boundaries in the United States, and the variety of ways social scientists have used census data in conducting research and building theory. Read on!
The Census and Social Science: Lessons for and from Conducting Research
Advances in social science methodology and research have contributed to developments in the Census. Though it is a rare and large research endeavor unlike any other, the Census is a great example of theoretical and methodological considerations that social scientists grapple with every day. Not only does the Census give us a chance to put sociological theory and methodology into action, but Census data has been important in social science literature and research across a variety of fields.
As one of the largest endeavors in data collection, the Census has many complicated issues to consider as part of the practical processes involved with research and the interpretation of data.
- In this #TSPClassic episode of Office Hours, we hear from Robert M Groves, a sociologist who was then Director of the Census Bureau, about how the Census manages and works through such complications.
- In this Clipping, Robin Autry speaks with The Atlantic about how researchers clean census data to deal with ambiguous, fluid concepts such as race and ethnicity.
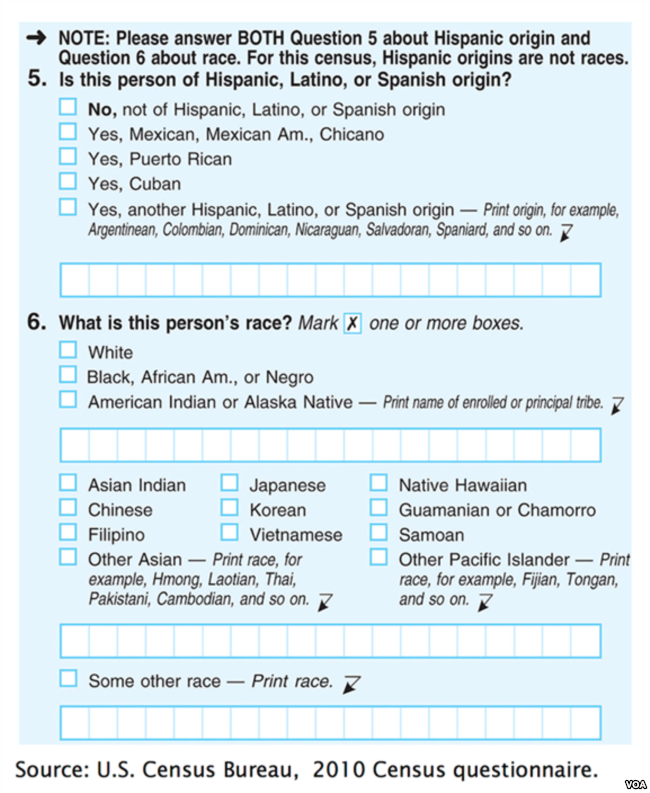
- Then, read this #TSPClassic from The Color Line about the preparation and planning behind the 2010 Census; how does such thinking relate to the 2020 Census?
Census data and related research can tell us a lot about our lives, particularly when it comes to where we live and how we work.
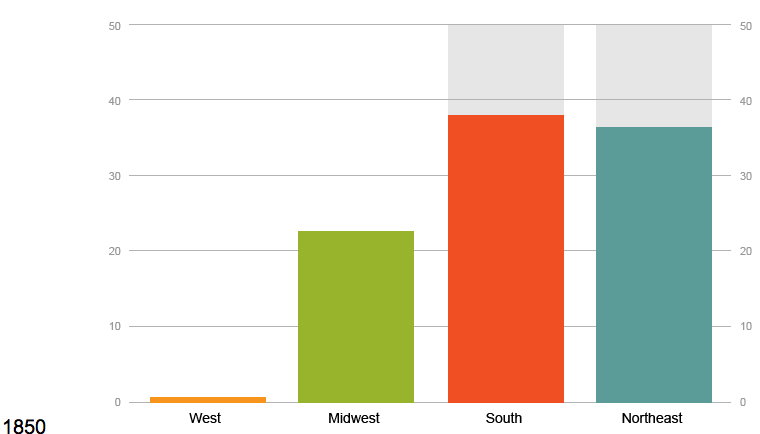
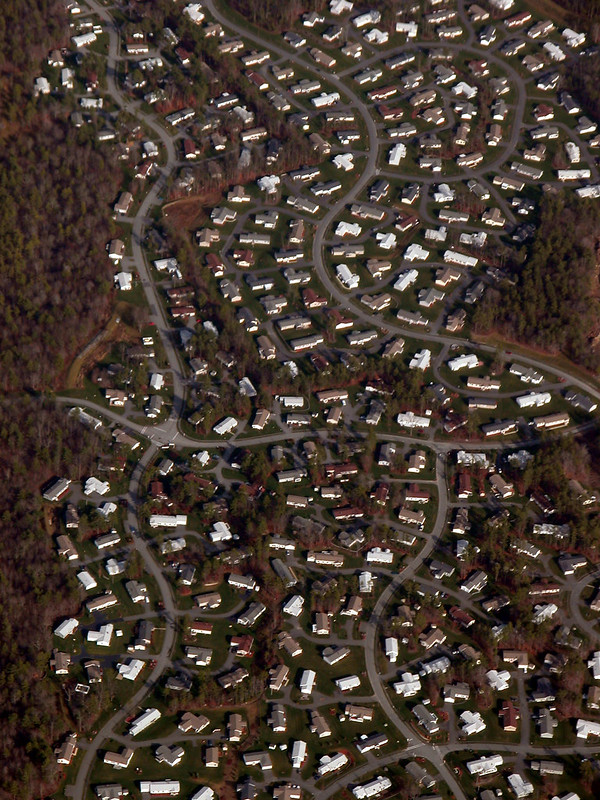
- Scholars have used such data to understand the history of urbanization and suburbanization in the United States; this Sociological Images post draws on census data to visualize the development of the modern American metropolis and contemporary communities.
- Read this Sociological Images post about inequalities in Americans’ commutes to work and access to transportation.
- Finally, see how Graphic Sociology uses on census data to discuss how unemployment and poverty relates to age, gender, and much more.
The Census can tell us a lot about the big picture, but what can it tell you about yourself?
- In this article from Contexts, Leah Sabo reflects on how thinking about the Census can teach us about the individual and make us think about our own lives. Read on to spark your sociological imagination about privilege, neighborhoods, diversity, and much more.
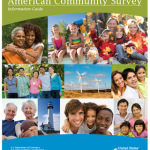
The Census, and subsidiary projects it manages such as the American Community Survey (ACS), provide incredibly important data for social science research. Though the ACS reaches fewer people than the one-a-decade Census, it gathers information about ancestry, neighborhoods, and communities in more detail and with more regularity.
- In this #TSPClassic from Council on Contemporary Families, Philip Cohen challenges proposed budget cuts to the ACS and explains why it is important to fund this survey and social science in general.
- Furthermore, such research processes are important around the world; read a Sociological Images piece about what other censuses around the world look like, based on resources from the American Anthropological Association.
The Census and Race: The Social Construction of Race and Diversity in the USA
“Race” is a social construction. Social forces shape how physical characteristics and groups become seen in racialized ways, and this happens through a variety of cultural and material processes. The ways the Census approaches race, ethnicity, and identity have changed drastically over its centuries-long history; much of this reflects shifting norms about racial categories and racism itself in the United States. Census data thus shows us how race and racial landscapes change, and the complexities of race in the United States.
Racial identification on the Census has changed and evolved.
- This Sociological Images post describes how the Census’ racial categories have changed over the years
- This Sociological Images post describes shifts in Census practices regarding the measurement of race through appearance versus identity.
- Be sure to read this summary of research on how the fluidity of racial identification on the Census can itself be a fluid process.
- These next two Clippings consider how the Census relates to the intersections of race, ethnicity, nationality, and citizenship: the first describes how the Census affects the historical development of “Hispanic” as an ethnic category, and the second points to complexities in measuring American-Indian identities in census data.
Census research has been used to study racial inequality both past and present.
- This post from Sociological Images uses census data to illustrate discuss historical quantification of slavery.
- And this #TSPClassic via Council on Contemporary Families draws on census data to discuss how, despite the passage of fifty years since the Civil Rights Act, racial inequality and disadvantage persist in a variety of outcomes.
- Finally, read this Sociological Images post to learn more about racial residential segregation in several American metropolises.
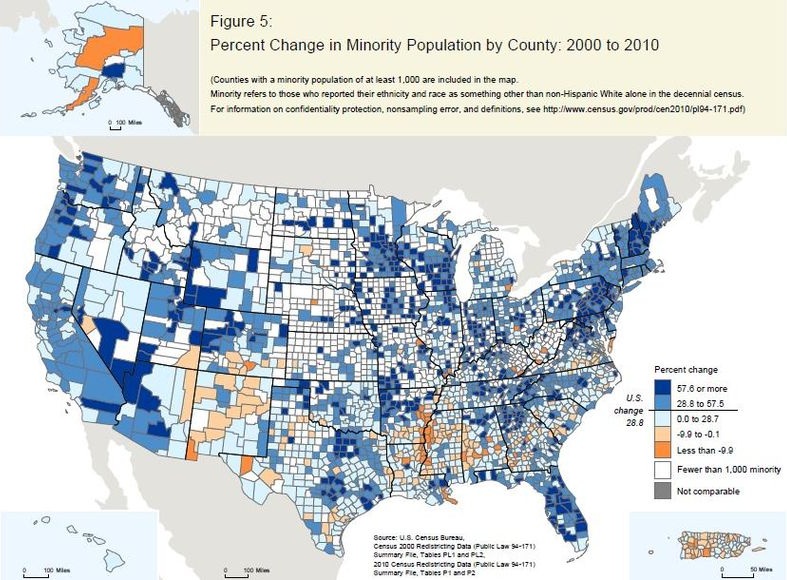
The twenty-first century has witnessed the rise of unprecedented racial and ethnic diversity in the United States.
- This post from Council on Contemporary Families uses census data to capture how America’s children are growing up in a new era of everyday diversity
- And this #TSPClassic from Sociological Images shows racial and ethnic diversity within American families.
- This Sociological Images post considers potential contrasts between the demographics of the mid-20th and the mid-21st century.
- Along these lines, read this post from Color Lines about the rise of interracial marriage and families, particularly for Asian-Americans.
The rise of difference and diversity has drawn discomfort, racial tensions, and backlash, and much of this comes from the ways that everyday people react to census data and population projects.
- This Clipping describes such reactions
- And this Clipping describes how census data can be used to stoke fears about immigration.
- Finally, be sure to read this #TSPClassic, a special feature about the “whitelash” against diversity.
As American diversity continues to rise, push back and resentment will surely continue to be relevant to how people use and react to census data. What will we see once the 2020 numbers come out?
Finally, it is important to recognize that rising racial diversity does not necessarily mean that racial inequality will disappear; in fact, sociologists often find the opposite. One such area of research is related to segregation and concentrated disadvantage, wherein non-white communities often have less cultural, political, and economic power.
- Be sure to read this Discoveries post about historical and contemporary racial segregation between the North and the South,
- And read this Clippings piece about how segregation persists despite an increasingly racially diverse population.
As we move into a future of greater difference, such ideas are important to keep in mind; what will the 2020 Census tell us about race, diversity, and inequality?
We hope you enjoy these #TSPClassics as much as we do, and we look forward to working with the 2020 Census data!