Updated April 25th, 2017
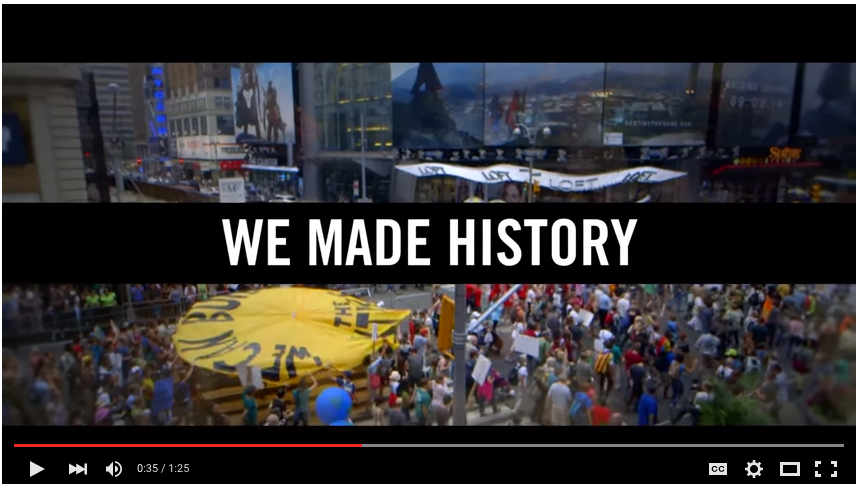
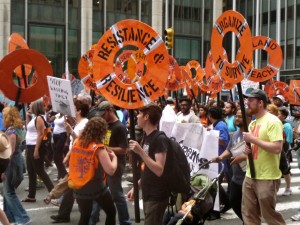
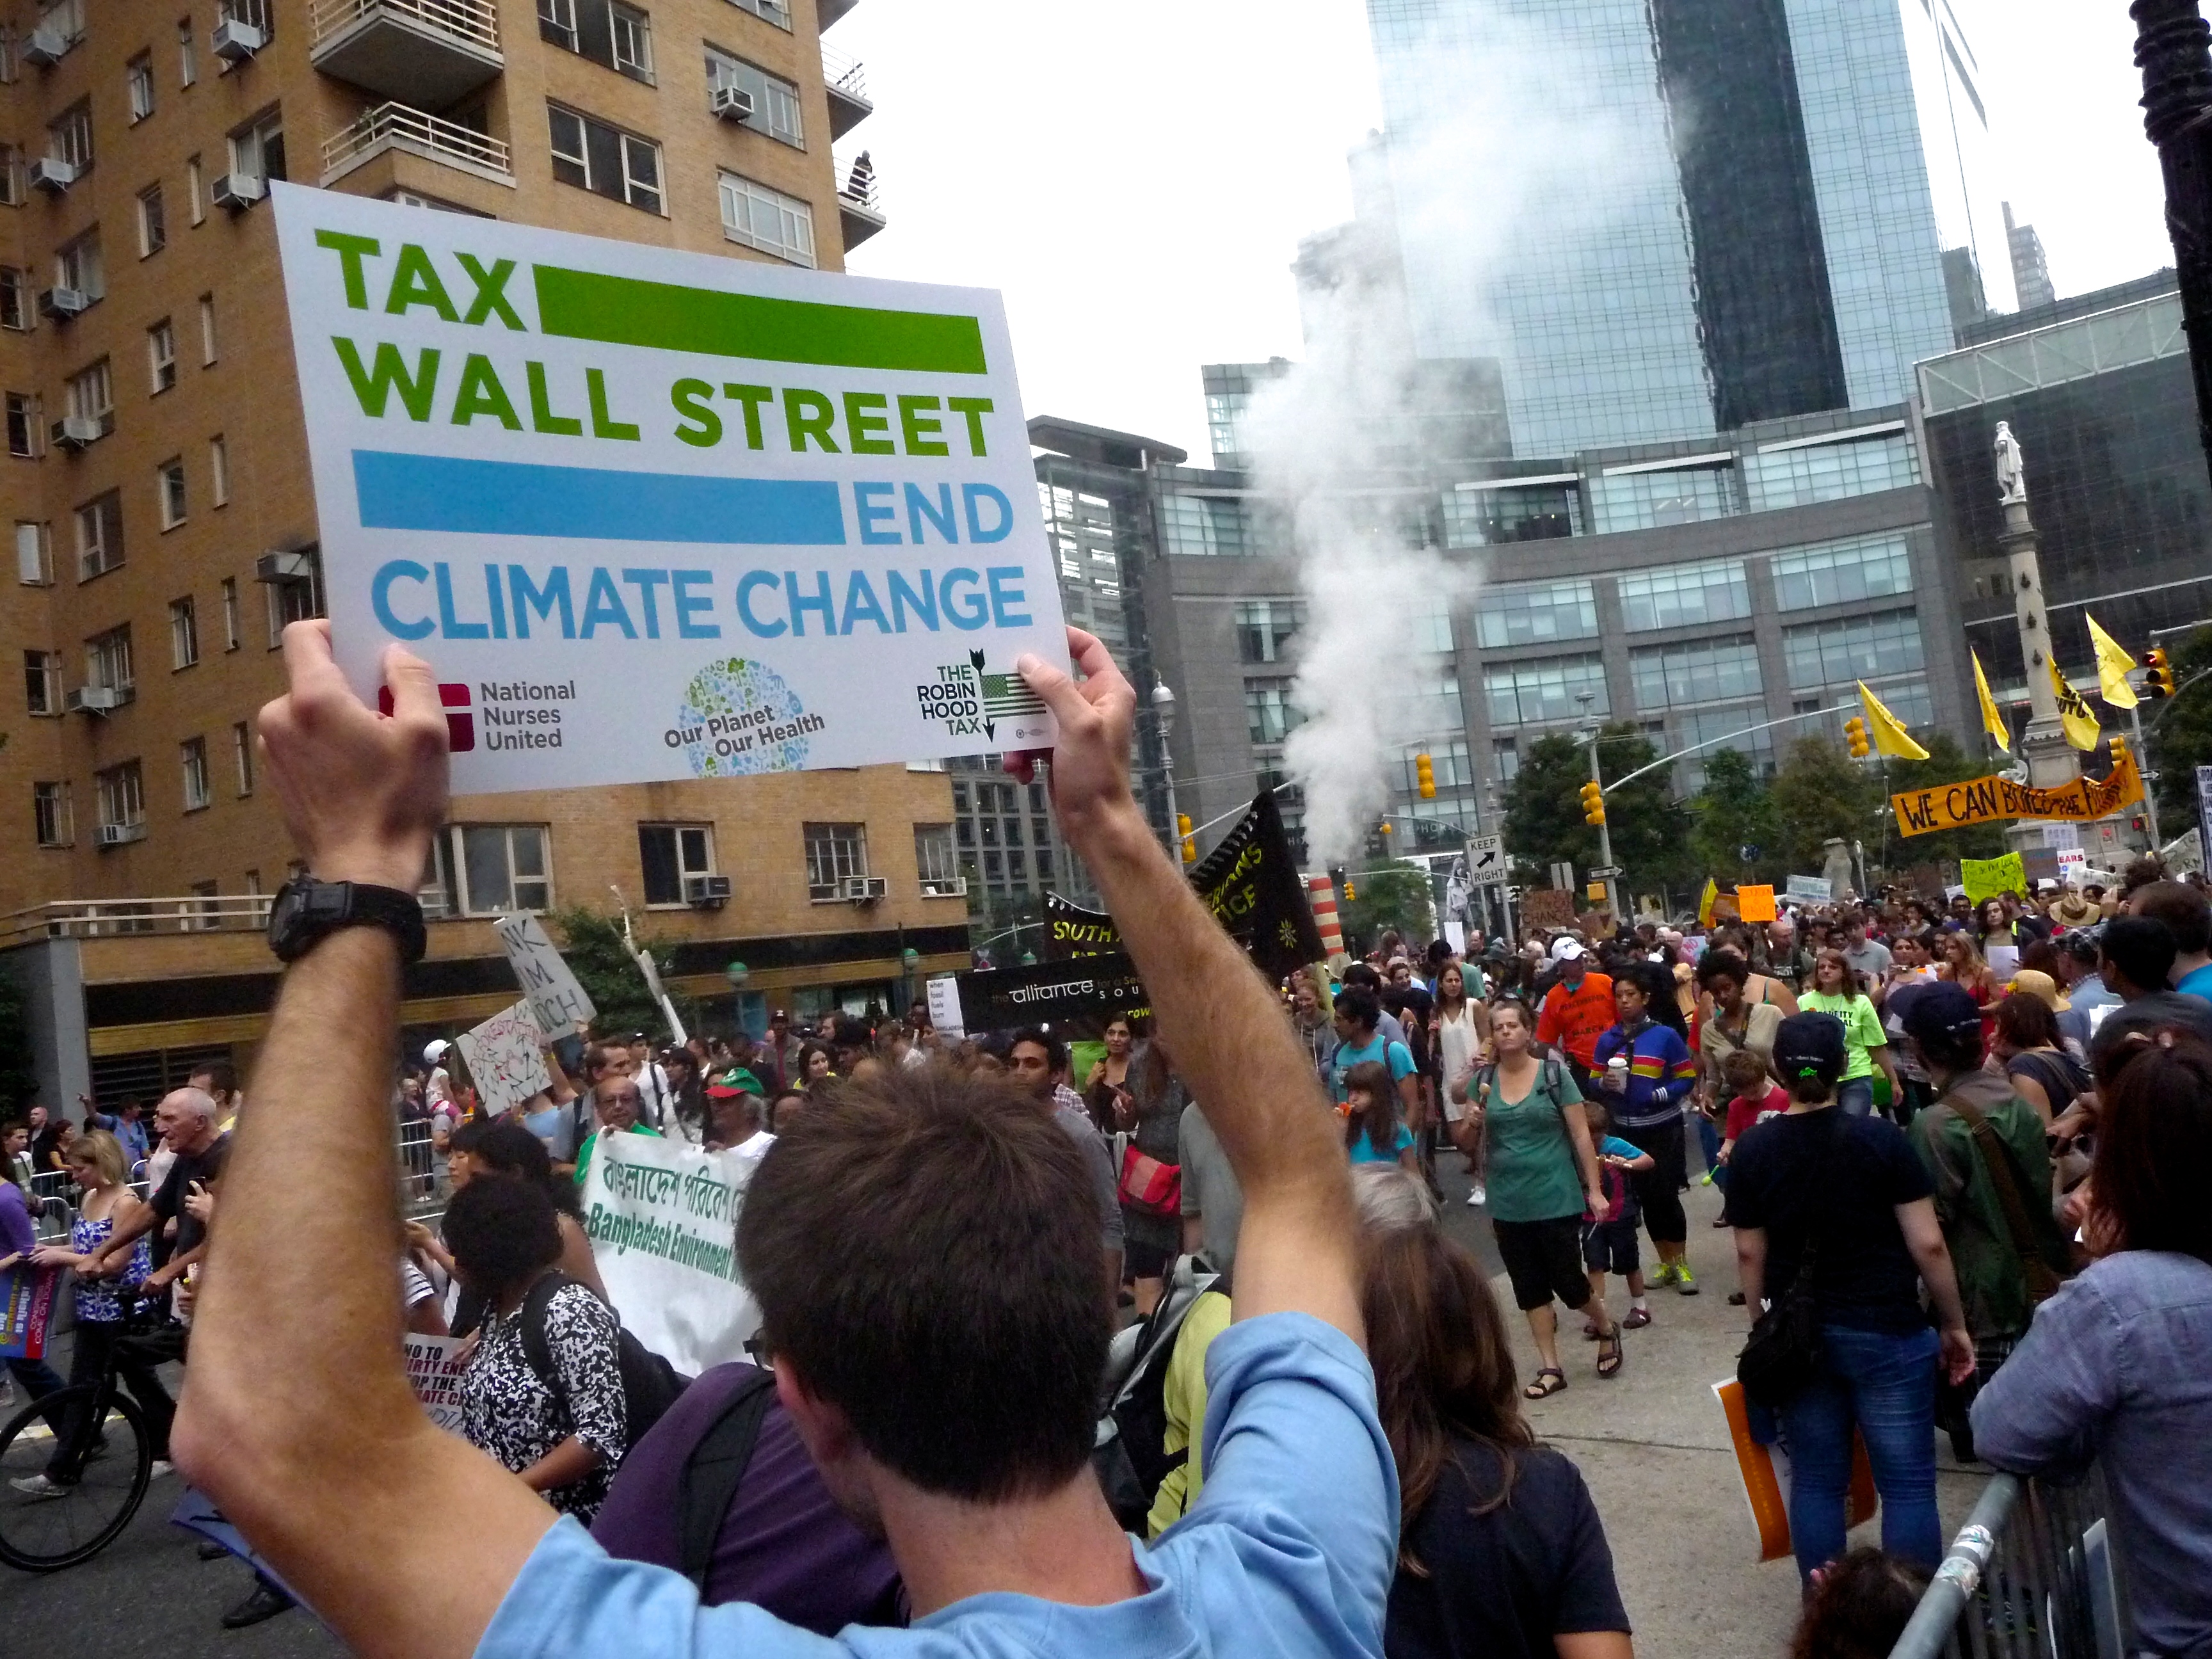
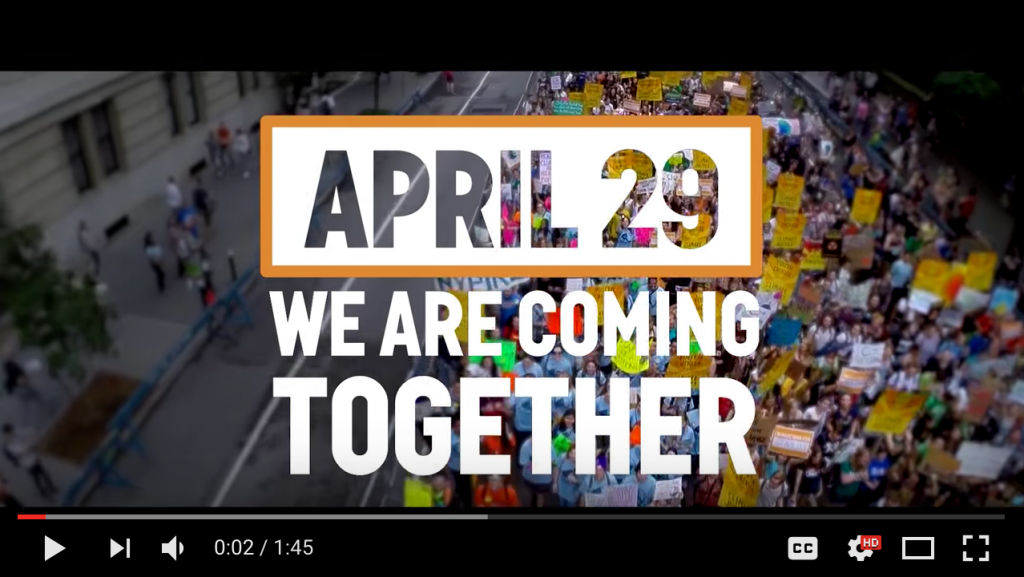
In the fall of 2014, the largest climate protest to date occurred at the People’s Climate March in New York City. An estimated 400,000 people marched demanding action on global warming. On April 29th, 2017 Washington, DC and dozens of other cities around the country and world will host the second People’s Climate March: March for Climate, Jobs and Justice.
See the celebratory video of the 2014 New York People’s Climate March by clicking on the image below.
 While the march was declared a success by the organizers, questions remain about whether the climate change movement is successfully overcoming past criticism that the mainstream environmental movement is too white, too wealthy, and too male.
Various media outposts have pointed out that the environmental movement, in general, is lacking diversity, that is, it is too white. In particular, Brentin Mock wrote about it extensively as a columnist for Grist (he recently moved to The Atlantic).
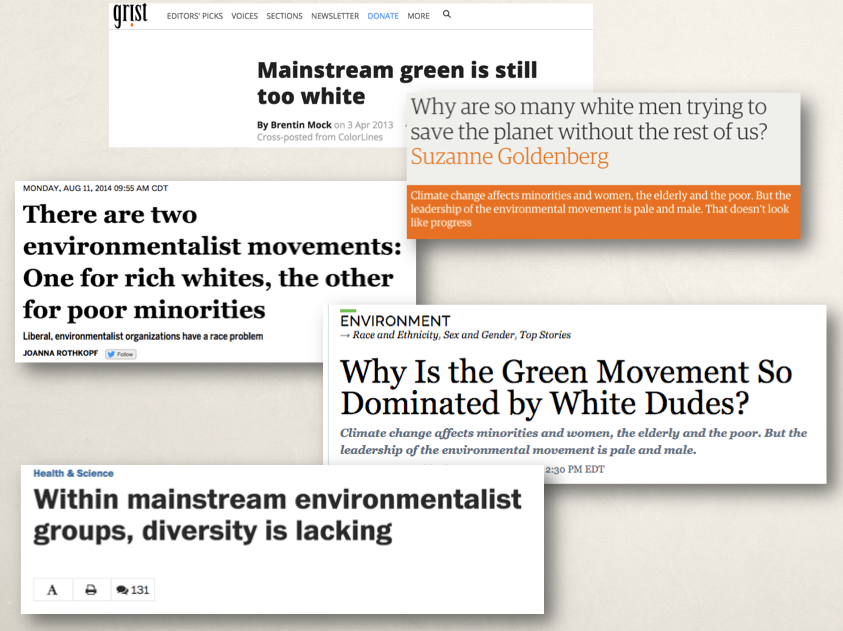
This is far from a new issue, but rather is something that organizations have supposedly been working on since at least the 1970s.
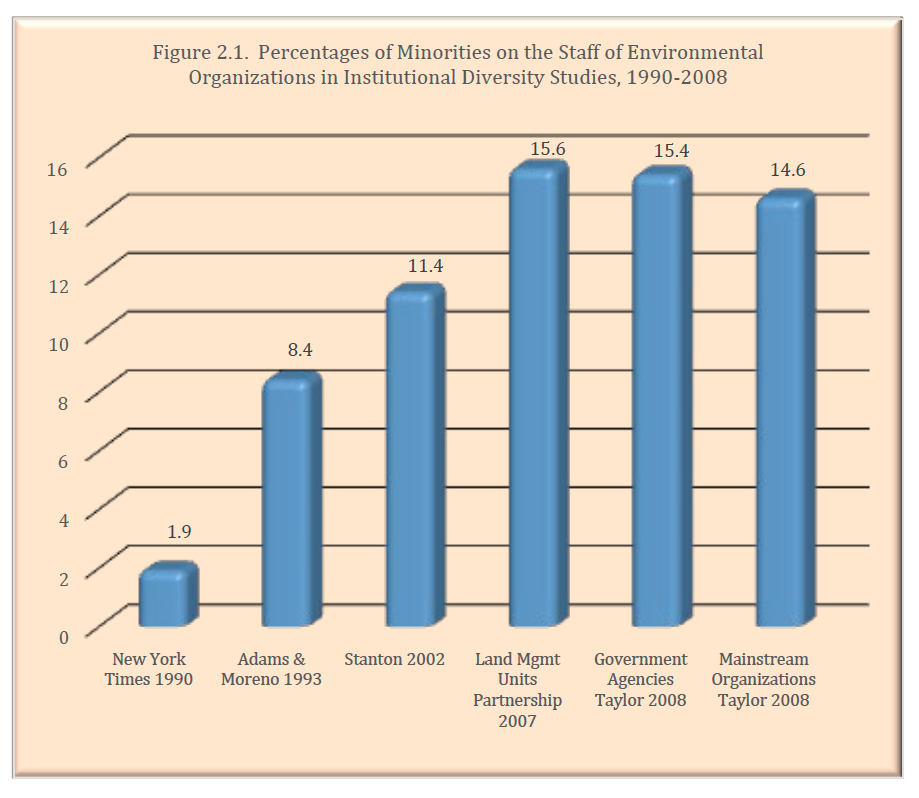
This lack of diversity has also been documented by several academics, most notably Dr. Dorceta Taylor at the University Michigan. Her 2014 report, The State of Diversity in Environmental Organizations, examines mainstream environmental NGOS, foundations, and government agencies for their degree of diversity of race/ethnicity, class, and gender.
The trends in Taylor’s data show that the percentage of minorities in leadership position in the environmental movement have increased since the 1990s but may have plateaued at a rate lower than the percentage of racial and ethnic minorities in the US population. See a key figure from her report below:
However, the report focuses on the organizations’ leadership, not the members.
Concerns about the diversity of the environmental movement more broadly continue as we head into the People’s Climate March in DC.
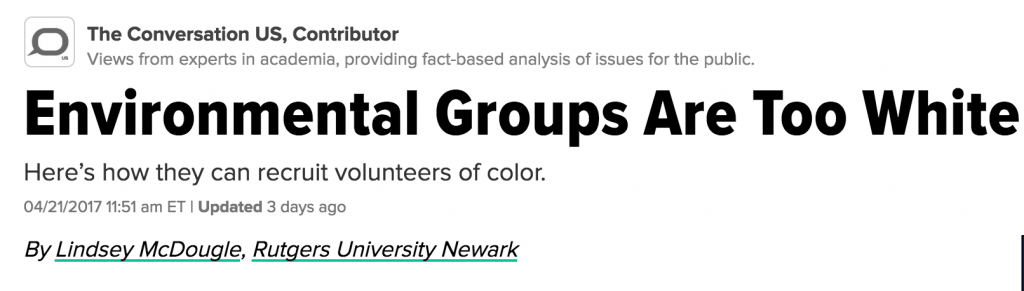
According to Lindsey McDougle, “The number of environmental groups has increased in recent years, growing nearly 20 percent from 11,233 in 2003 to 13,283 in 2013. Despite this growth, people from communities of color engage in environmental volunteerism at lower rates than whites, according to the Bureau of Labor Statistics. In 2015, for instance, 3.1 percent of white Americans volunteered for green causes, while only 1.6 percent of Latinos and 1 percent of black Americans did so.”
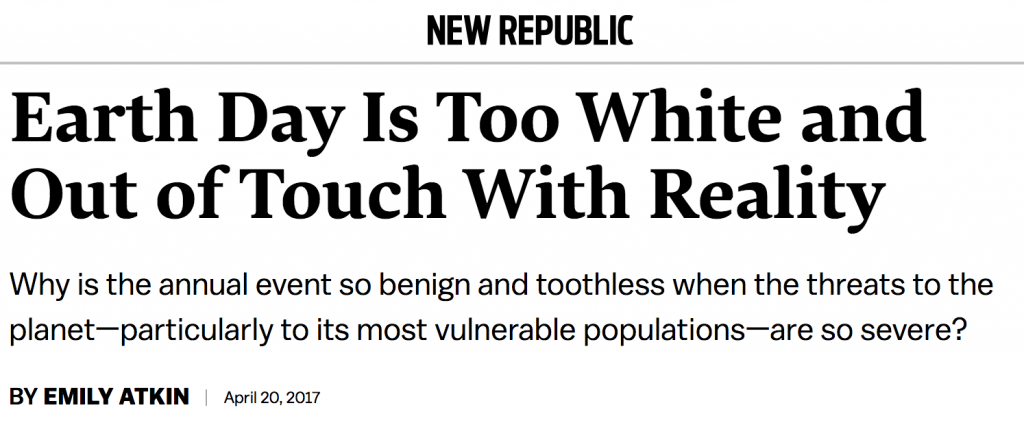
Others have been critical of Earth Day, as lacking an appropriate edge, based on the current state of the planet. Emily Atkin writes in the New Republic, “Why is Earth Day so benign and toothless when the immediate threats to the planet—particularly to its most vulnerable populations—are so severe?”
Previously, in response to Trump’s executive orders and proposed budget decimating the EPA, she wrote, “Largely missing from [the] attacks were fears about how Trump’s executive order could disproportionately hurt people living in low-income, minority, and indigenous communities. Environmental justice advocates say they’re used to this issue being overlooked. And perhaps there is some logic to the broader focus on global warming; after all, if the planet gets too hot, we’re all doomed.
What about the people who are being mobilized in the streets demanding action on climate change. Who’s voices are these?
Are organizations doing enough to ensure the movement represents the increasing racial and gender diversity of US society? As income inequality grows in our society, is the climate change movement an income-diverse movement or is it the wealthier voices that are being heard?
With the help of a team of nearly 20 research assistants I collected just over 1,000 surveys from a random sample of protestors at the 2014 People’s Climate March. Anecdotally, looking at the crowd that was in New York City that day it was diverse in a number of ways: race, gender, issue orientation, and age. However, random sample survey data provides more accurate information than one’s individual observations.
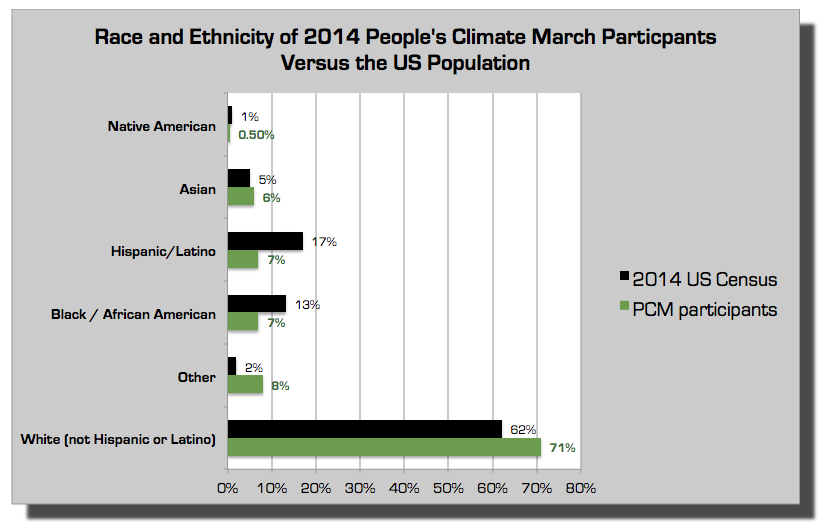
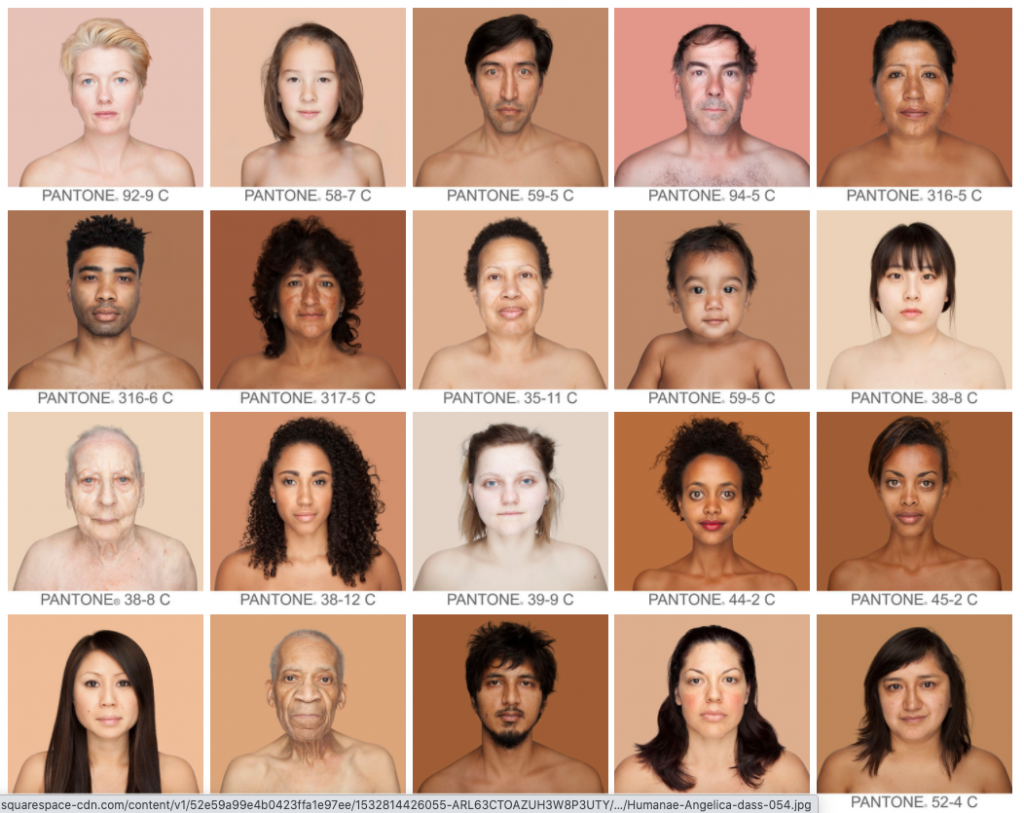
The general population of the US is a majority white (at least for another decade or two), so we would expect that whites are still the most predominant in number at such an event. However, we can look at the proportions of different races and ethnicities in the US as a whole and compare that to the proportions at the 2014 People’s Climate March to examine the level of diversity at the march.
Despite the awareness that the environmental movement has historically lacked diversity, the People’s Climate March was still disproportionally white. In 2014, whites (according to US Census estimates) represented 62% of the population as a whole, yet they were over-represented as 71% of the protesters at the People’s Climate March. Hispanic and Latinos were well underrepresented as they make up 17% of the US population but only 7% of the protesters that day in New York City. Blacks made up only 7% of the People’s Climate March activists, while making up 13% of the total population in 2014. Native Americans were also underrepresented as only 0.5% of the marchers but 1.2% of the US population. Asians were slightly over-represented as 6% of the marchers and 5% of the overall population. The “other” category represents bi-racial identities and (in the data below) Native Hawaiian and Pacific Islanders.
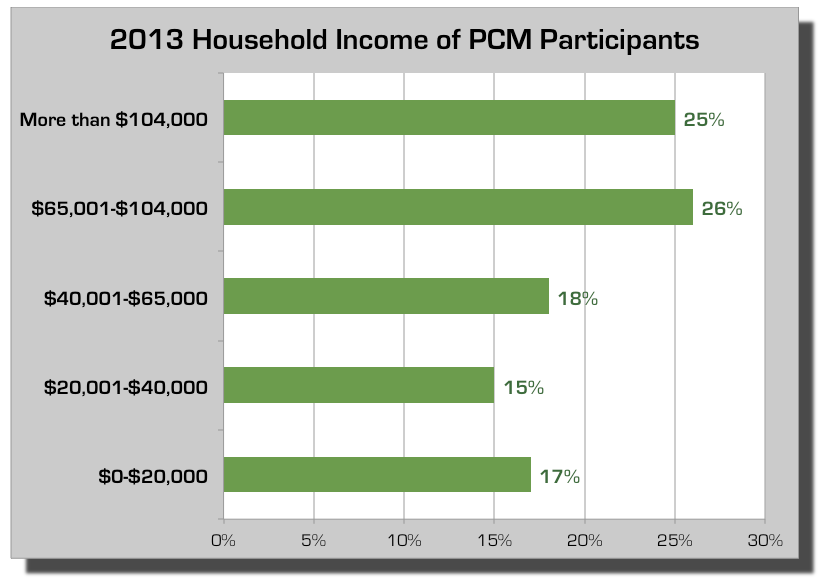
It is not just racial and ethnic diversity that is of concern, but also economic diversity. Is the climate change movement, like the mainstream environmental movement, disproportionally upper-middle and upper class? One way of measuring the income distribution is dividing the population by five, or into clusters of 20% of the population (quintiles). The survey data indicates that participants in the 2014 People’s Climate March disproportionally fell into the upper two quintile income brackets in the US. The income ranges in the figure below each represent 20% of the US population. If the protesters were evenly distributed across incomes, each of the bars in the figure below would be at 20%. Instead, the data shows that just over 50% of the protesters were from the top two US income quintiles in the US. Just 32% of the protesters were from the bottom two quintiles.
. . .
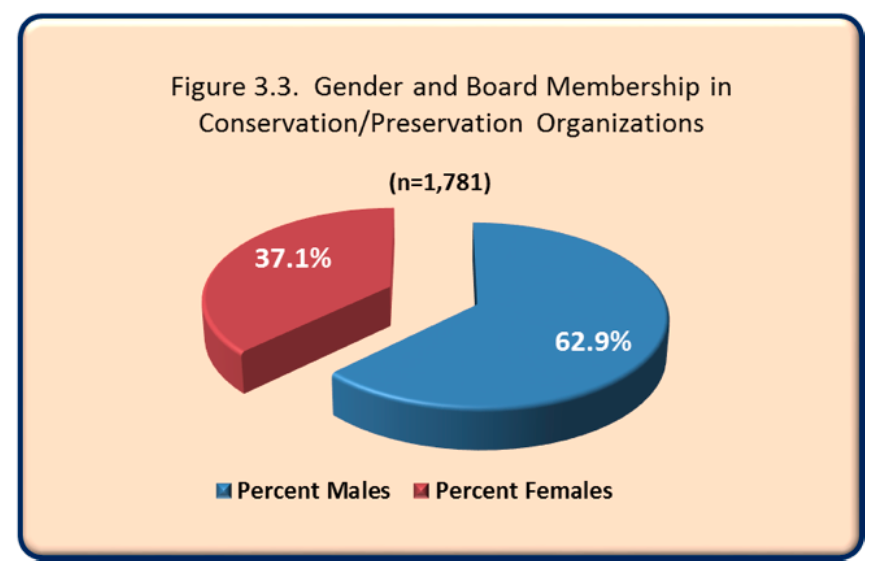
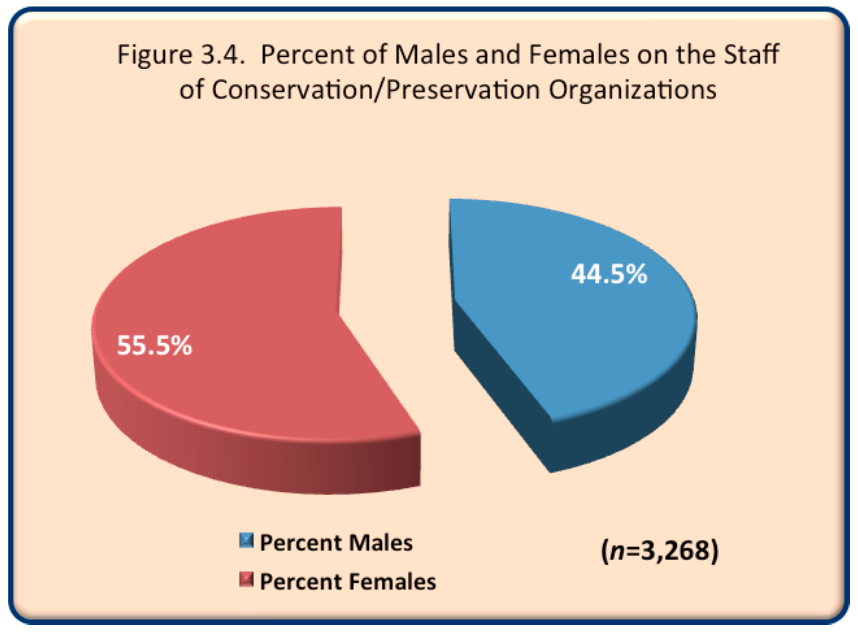
Lastly, the gender distribution within environmental organizations has also been criticized as disproportionally male. Dorceta Taylor’s research shows that the boards of organizations remain disproportionally male, while the staff are disproportionally female, as seen in her charts below.
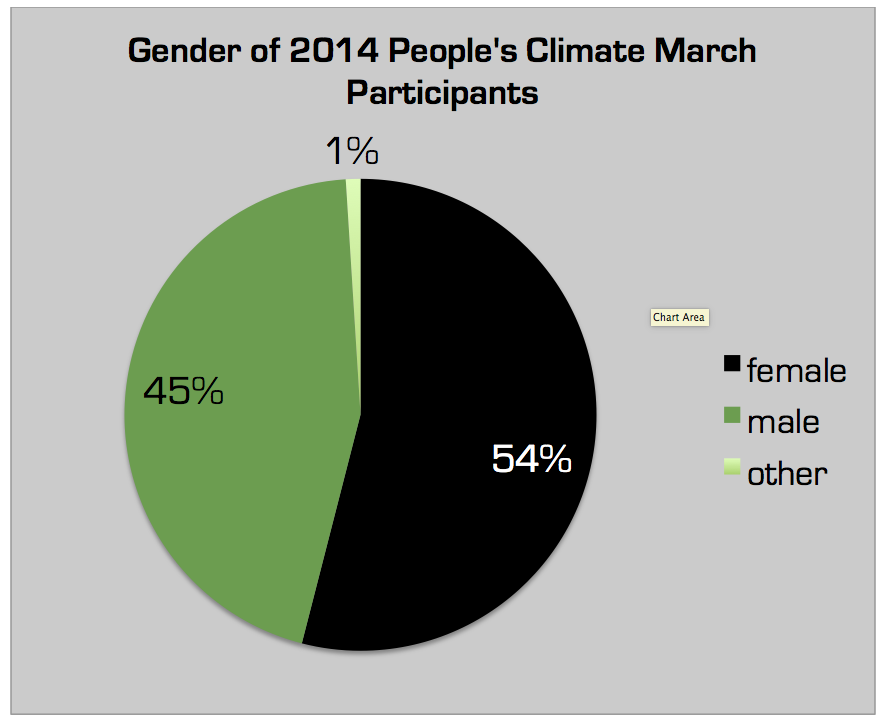
The participants in the historical 2014 People’s Climate March were split in roughly the same gender proportions as the US population (see the figure below). The gender distribution of marchers shows greater equality than either the race/ethnicity or income distribution.
Regarding leadership, 350.org is the main organizer of the People’s Climate March both in 2014 and 2017. A quick count of the staff listed on 350.org’s web page (as of October 2015) indicates that 57% of their global staff are women. Of their seven board members, four are women.
. . .
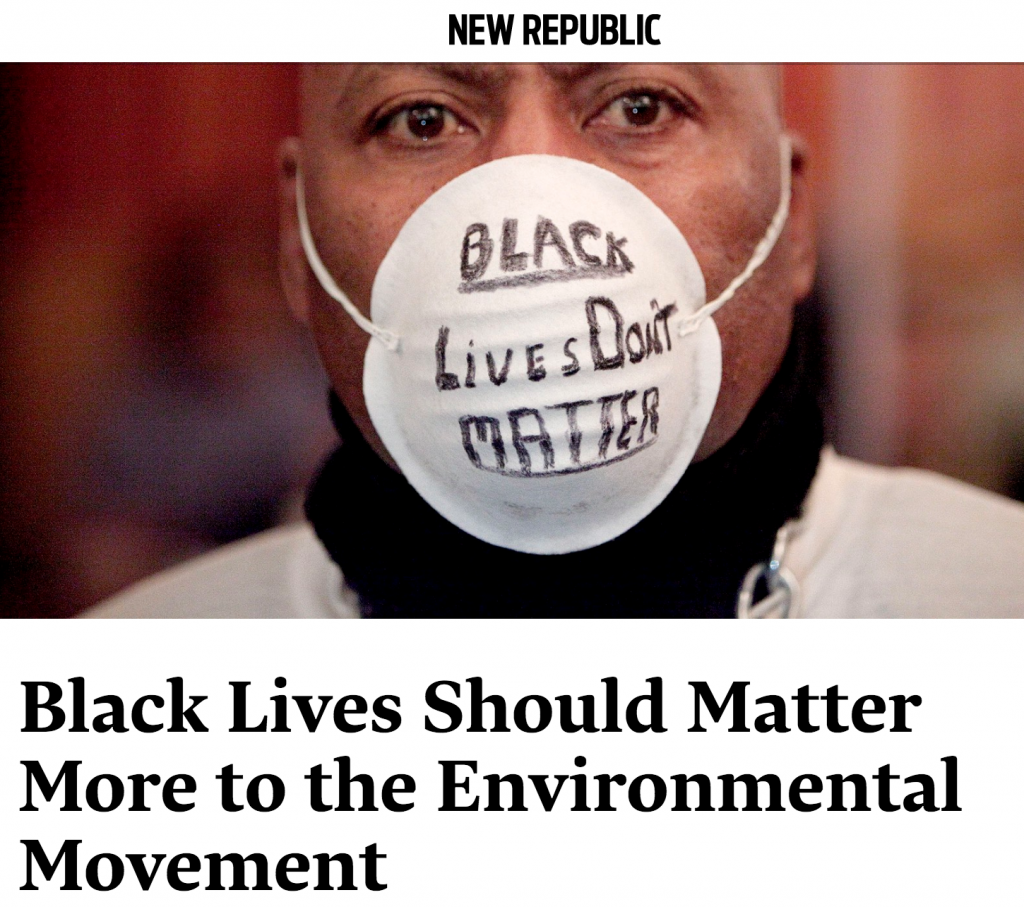
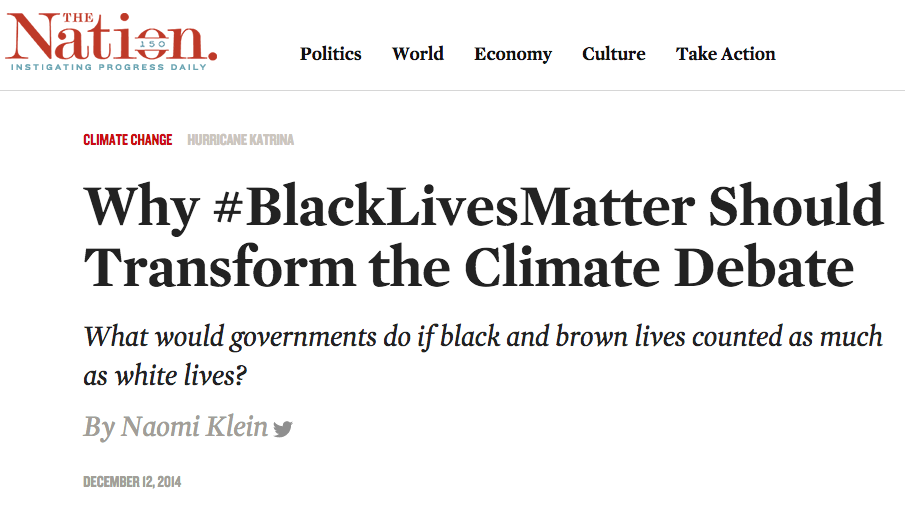
Climate organizations need to make a greater and continued effort to ensure that all the communities being negatively impacted by climate change have a voice and are present in the mass mobilizations. We continue to live in a racialized society (see my previous posts if in doubt, here, here and here among others) and overcoming that will take intentional effort, reaching out to minority groups with specific rather than open invitations, and ensuring that they are part of the planning not just invited at the last minute. As Naomi Klein, prominent author and board member of 350.org writes in the article linked to below:
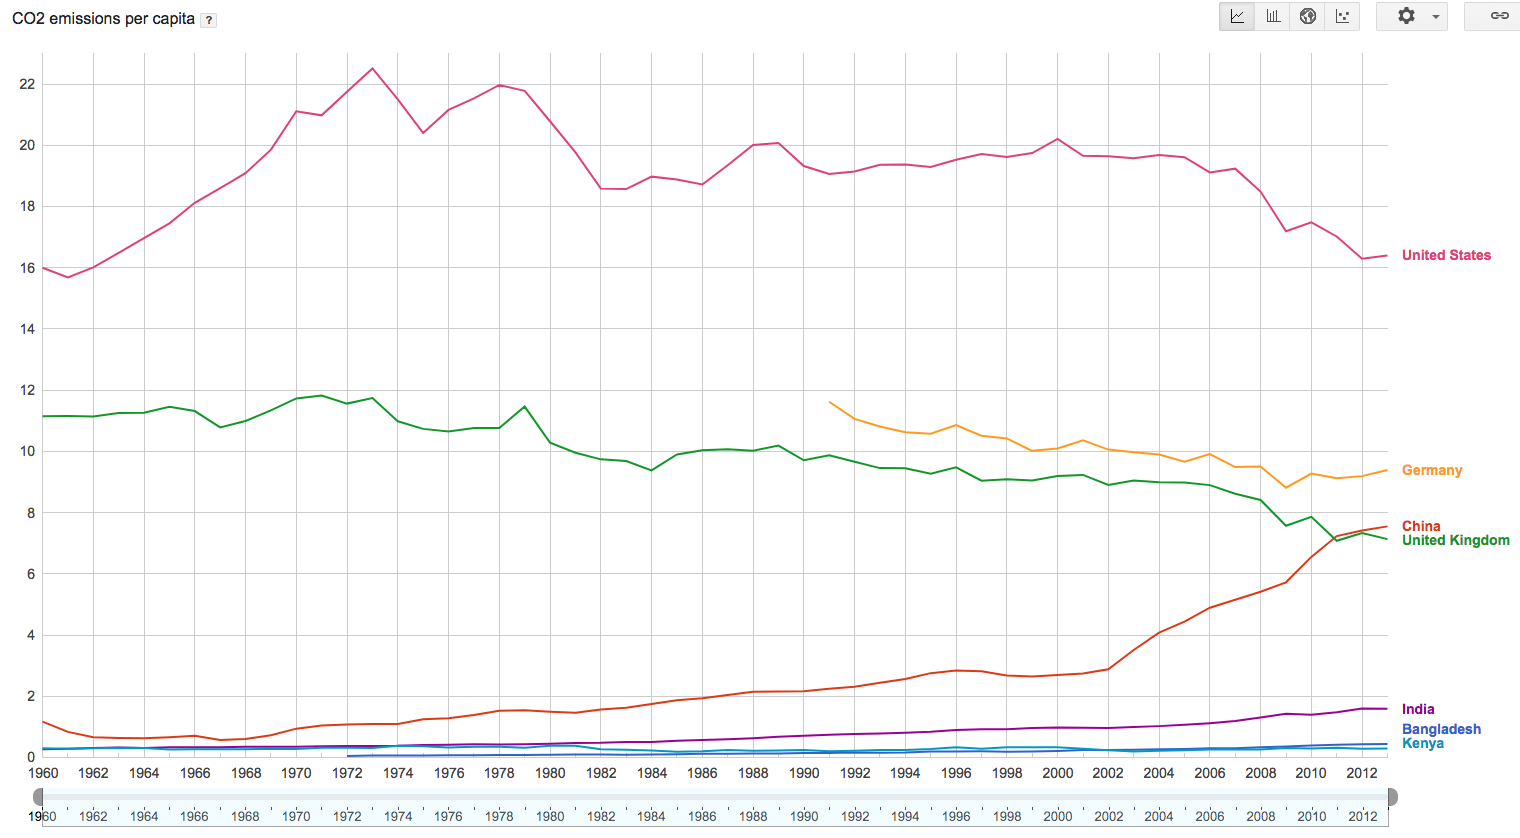
“What does #BlackLivesMatter, and the unshakable moral principle that it represents, have to do with climate change? Everything. Because we can be quite sure that if wealthy white Americans had been the ones left without food and water for days in a giant sports stadium after Hurricane Katrina, even George W. Bush would have gotten serious about climate change. Similarly, if Australia were at risk of disappearing, and not large parts of Bangladesh, Prime Minister Tony Abbott would be a lot less likely to publicly celebrate the burning of coal as “good for humanity,” as he did on the occasion of the opening of a vast new coal mine. And if my own city of Toronto were being battered, year after year, by historic typhoons demanding mass evacuations, and not Tacloban in the Philippines, we can also be sure that Canada would not have made building tar sands pipelines the centerpiece of its foreign policy.”
This piece has focused on the movement in the US and around one particular mass mobilization. It is important to remember that the lack of diversity at the People’s Climate March was not because the working class and racial minorities don’t care about the issue (nor was it that the organizers did not care about diversity). The NAACP has a campaign called the Climate Justice Initiative that “works at addressing the many practices that are harming communities nationwide and worldwide and the policies needed to rectify these impacts.” Nations of the Global South, predominantly not white and less developed than the advanced industrialized Western nations (read greenhouse gas emitters) have been mobilizing against climate change for some time now. On the African continent, there is the Pan African Climate Justice Alliance (PACJA). Others include Focus on the Global South, La Via Campesina, and many others. See some survey data on the views of organizational members of the Pan African Climate Justice Alliance here.
The US climate movement must stay focused on the principles of climate justice if it wants to be inclusive and not just the mass mobilization of wealthy, white, males. While improvements in this area have been made, much remains to be done.
I’ll have another research team collecting survey data at the 2017 march in both DC and Chicago. Watch for updated data as those results come in. See you at the protest!
Teach well, it matters.
. . .
A couple of “thinking critically” caveats about the data that need to be considered. First, in conjunction with the main event, the People’s Climate March in New York City, there were a few hundred other smaller protests held in cities throughout the country and world. My data is limited to the New York City event. While we could speculate that these other events may have been more racially and economically diverse (but we have to reason to believe so), the bulk of the organizing efforts seemed to go into the march in New York City. The main march, with an estimated 400,000 people is the event that received the media attention, the primary purpose of the event. So, even if the smaller, more local events were of greater diversity, they were peripheral.
Secondly, the event was held in New York City and the income distribution within the metropolitan area is skewed slightly upward relative to the nation as a whole. While the organizers made a herculean effort to bring in people from all over the country, there is a still a chance that the crowd was predominantly from New York City. If we only considered the income distribution in NYC, this would likely result in a more even distribution among income quintiles.
. . .


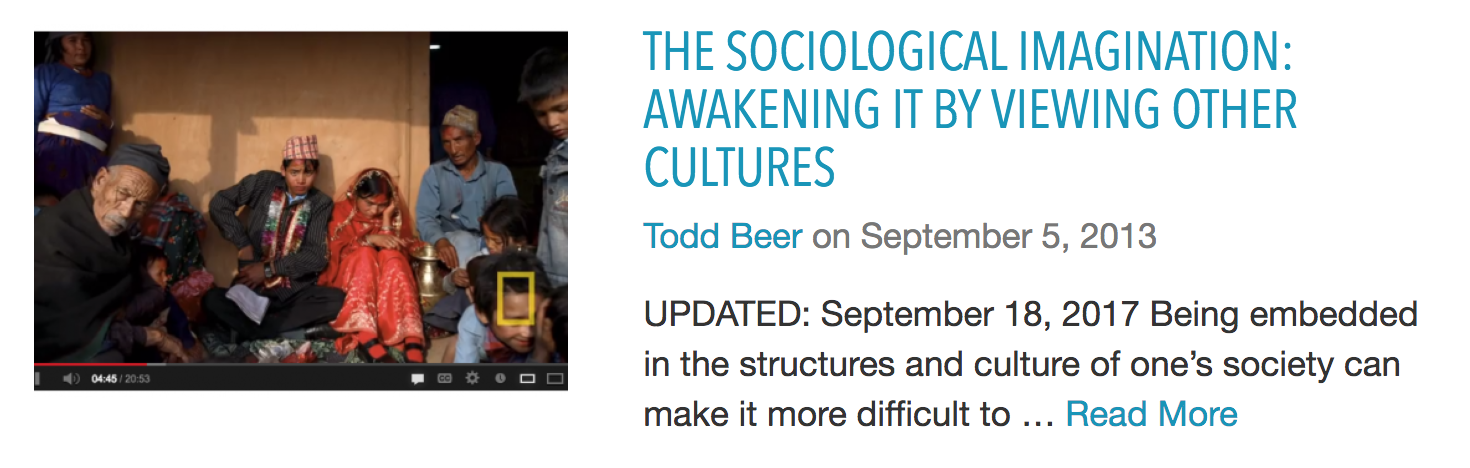
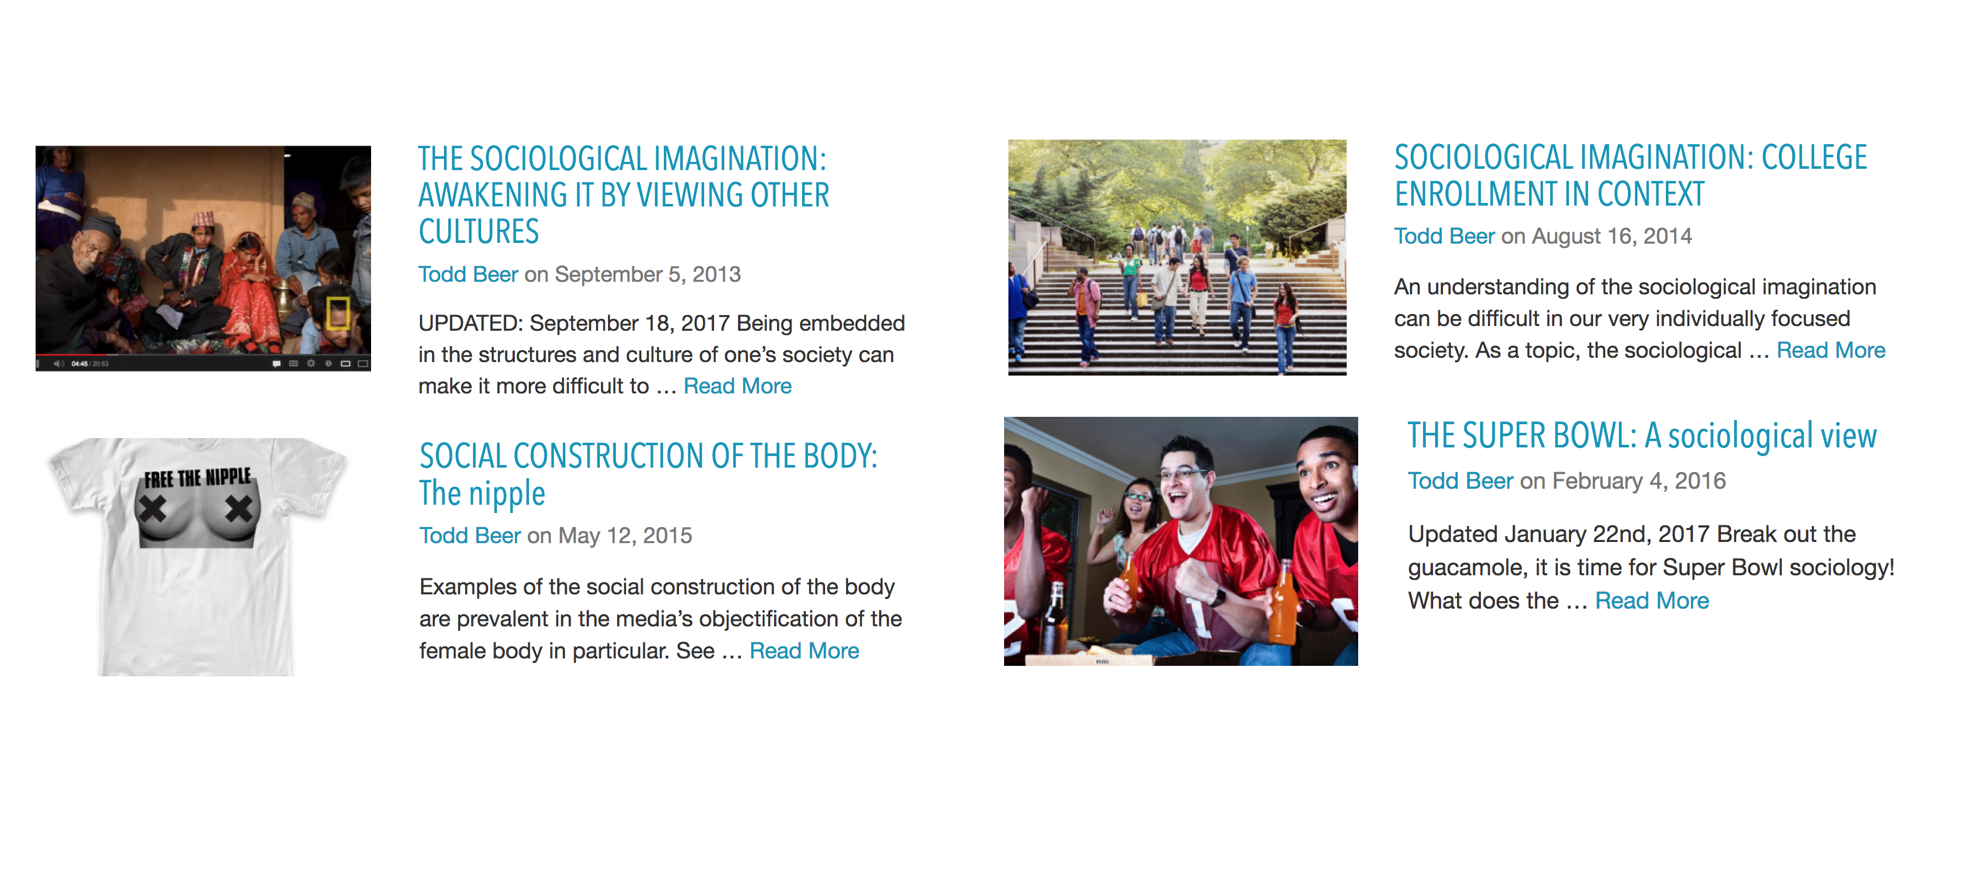 As a new semester is about to begin, here are some of my most popular and effective tools for teaching the early-semester topic in most Introduction to Sociology courses, the sociological imagination.