
TEACHING ABOUT CLIMATE CHANGE IN SOCIOLOGY COURSES IS VITAL  and should arguably include a focus on CLIMATE JUSTICE. Teaching students about climate change should not be limited to courses in the natural sciences for many reasons, including:
- the causes of climate change are rooted in our economic modes of production.
- it will likely cause significant reorganization of our societies in the coming decades.
- cultural debates about the validity of science are social and political constructs.
- the causes and consequences of climate change are rooted in global and national inequality.
In the coming days, the Intergovernmental Panel 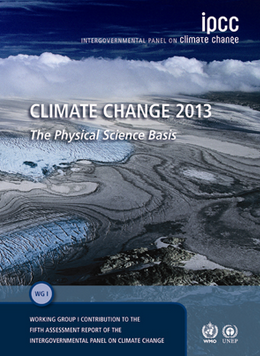 on Climate Change (IPCC) will release the beginning of their 5th assessment report explaining the physical science evidence for climate change. The news and public discourse that is sure to emerge is a great opportunity to explore the topic in the classroom.
From a sociological perspective, I believe CLIMATE JUSTICE is the most powerful topic, although climate change is also a great topic to cover the sociology of science, the production of doubt by US political think tanks, environmental sociology, development, and social movements, among others. The ideas of climate justice are rooted in the unequal distribution of the harms generated by climate change being felt by many NOW (not just in the coming decades), mostly by those who have contributed very little to the problem. Today I will focus on the emissions side of climate justice.
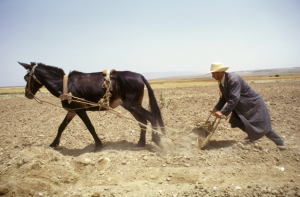
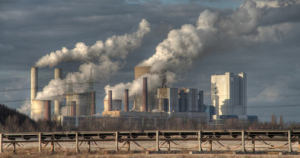
HISTORICAL EMISSIONS The emissions that are continuing to cause global warming are rooted in the industrial revolution, a process that emerged beginning in the late 1700s in some, but not all nations. Eventually, the mechanization of production replaced human, animal, or simple hydrologic power with fossil fuels – coal, oil, and natural gas. Burning these fuels in engines, machines, and power plants in the heavily industrialized West has subsequently been occurring for a solid couple of centuries – contributing to the changes in the climate we are experiencing today. This historically-high level of the consumption of fossil fuels is not the case in nations of the world that were delayed in their industrialization due to colonization and other forces.
Carbon dioxide and other greenhouse gasses take 20-200 years to work their way out of the atmosphere. When we talk about responsibility for climate change, we need to look at historical emissions, not just current emissions. The top 10 nations responsible for cumulative national emission from 1850-2007 include:
- US: 339,174 Metric Tons (MT) or 28.8%
- China: 105,915 MT or 9.0%
- Russia: 94,679 MT or 8.0%
- Germany: 81,194.5 MT or 6.9%
- UK: 68,763 MT or 5.8%
- Japan: 45,629 MT or 3.87%
- France: 32,667 MT or 2.77%
- India: 28,824 MT or 2.44%
- Canada: 25,716 MT or 2.2%
- Ukraine: 25,431 MT or 2.2%
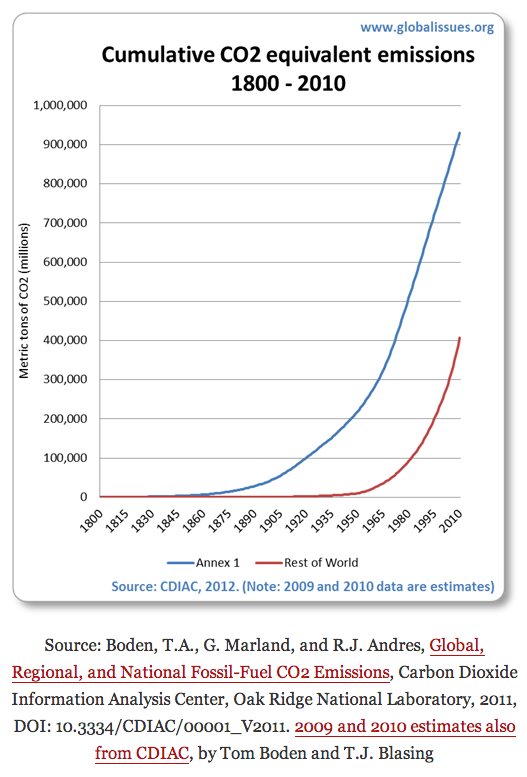
Looking globally at the historical (1800-2010) emissions of highly-industrialized nations as a group compared to “developing” nations as a group shows inequality in the CAUSE OF CLIMATE CHANGE:
Graphically, it can be represented on a map such as this one from the Guardian newspaper: 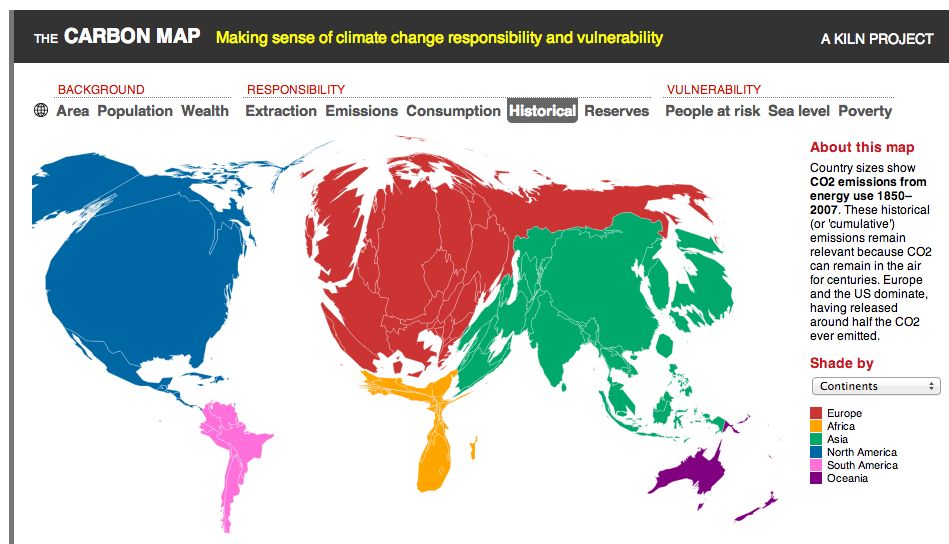
While historical emissions are important for considering responsibility for climate change, considering nations as similarly equal units is problematic. Nations vary greatly in their populations, therefore, per capita emissions should be considered.
PER CAPITA EMISSIONS
While China is the world’s leading emitter (in total emissions) they also have the world’s largest population. Using Google’s Public Data tool or the World Bank’s DataBank you can create graphs that clearly demonstrate the differences in per capita emissions over time.

So, historically, certain nations are more responsible for climate change than others. The generation of the emissions through the burning of fossil fuels generated wealth and development – these nations benefitted from these emissions. Who is being harmed by and remains at greater risk due to the process of climate change? That is a different story and will have to wait for an upcoming blog post.
Some resources (click to be redirected to):
- ASA Task Force on CLIMATE CHANGE
- PUBLICATION: WORKSHOP ON SOCIOLOGICAL PERSPECTIVES ON GLOBAL CLIMATE CHANGE (pdf)
- THE GUARDIAN NEWSPAPER’S EXCELLENT WEB SITE ON CLIMATE CHANGE
- WORLD RESOURCES INSTITUTE CLIMATE CHANGE WEB PAGE
- ARTICLE: “In Defence of Historical Accountability for Greenhouse Gas Emissions” by Eric Neumayer. Ecological Economics, 33 (2), 2000, pp. 185-192 (pdf)
- ARTICLE: “The problem of assigning responsibility for greenhouse gas emissions” by Simone Bastianoni, Federico Maria Pulselli, Enzo Tiezzi
- ARTICLE: “Climate Change: What Role for Sociology?A Response to Constance Lever-Tracy” by Reiner Grundmann and Nico Stehr
Teach well, it matters.
. . .
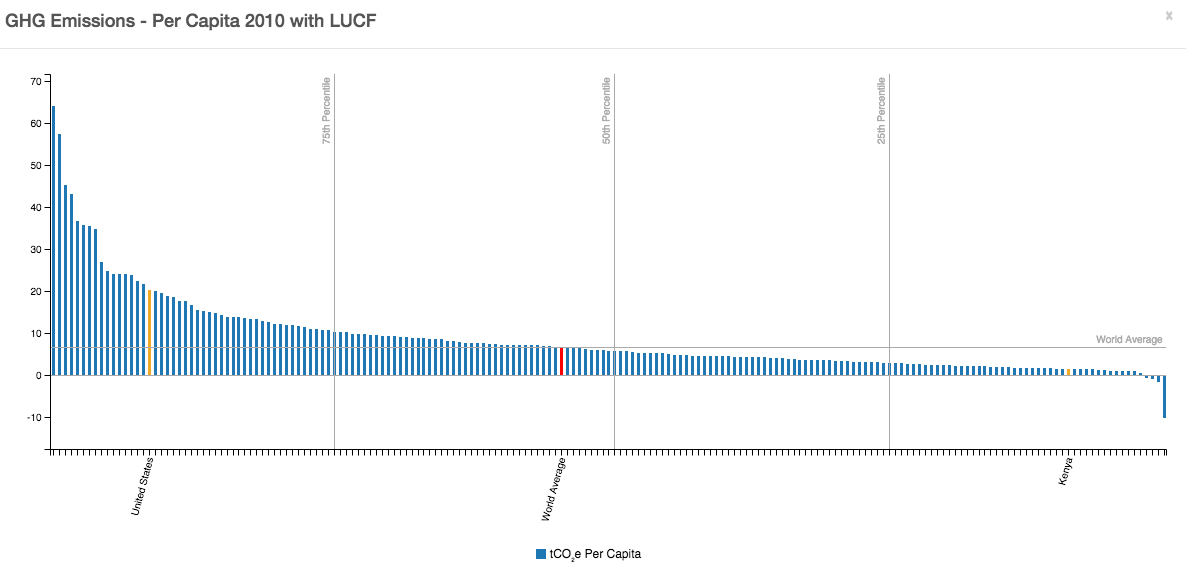
An additional tool great for illustrating climate justice from the World Resources Institute allows you to select current, per capita or historical emissions by nation. (Click on the image below to go to the tool)
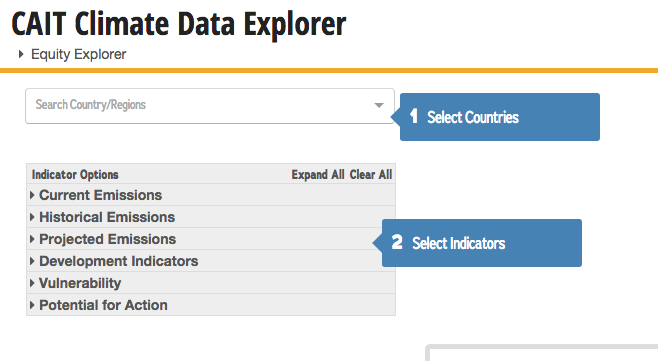
It allows you to produce bar charts that show the dramatic difference among nations and their greenhouse gas (GHG) emissions.
. . .
The head of the Catholic church, Pope Francis, weighed in on the topic of climate justice recently. Read his Encyclical that is a heavy critique of the market and our destruction of the environment. Click below for the full document.

. . .
Comments 2
CLIMATE JUSTICE: An analogy - Sociology Toolbox — June 9, 2016
[…] they are more empathetic to more abstract global realities. For more detailed analysis, see my earlier post exploring the different ways to measure who is responsible for climate […]
CLIMATE JUSTICE: Tools for teaching - Sociology Toolbox — November 6, 2017
[…] of my previous posts explores the variation in the causes and consequences of climate change. Below, the emissions of […]