
 The war on drugs impacts people differently based on race. The rate of drug use among populations does not correspond to the rate of incarceration for drug use. Many students often assume that the higher rate of African American males in US prisons is simply a reflection of higher rates of crime. After all, it is called the justice system. An extensive report by the ACLU provides a short video, graphic presentations of the data, and a pdf of the full report on marijuana use and arrest rates among blacks and whites.
The results demonstrate that  drug use and arrest rates are not correlated. In fact, in 2010 blacks were nearly four times as likely to be arrested for marijuana possession as whites nationwide despite reporting very similar rates of use (within 1 – 2.5%). The rates of use among 18-25 year olds from 2001-2010, show consistently higher rates of use by whites (2 – 5% higher). Looking at those who report never having smoked pot, blacks report higher levels (of non-use) than whites.
Moving beyond empirical reporting to theoretical explanations the report references relevant sociological research such as Sampson and Raudenbush’s 2004 article in Social Psychology Quarterly.
This material is an excellent resource for a criminology, deviance, or race section of any course. The full report (nearly 200 pages) has more extensive explanations of the multiple sources of data that were used and the rationale behind simplifying the race categories to black and white. The macro data is supplemented with a few personalized vignettes that individualize the larger social consequences – something I have found helps students more fully comprehend any issue.
The full report (which is free to download) ends with a state by state analysis of arrest rates by race, expenditures on enforcing laws against marijuana, and a map showing counties that exceed the national average in the racial disparity of arrests. These individual state reports allow students to see the issue from a national and more local level. “Here is the situation nationally in the US, how does our county compare?” 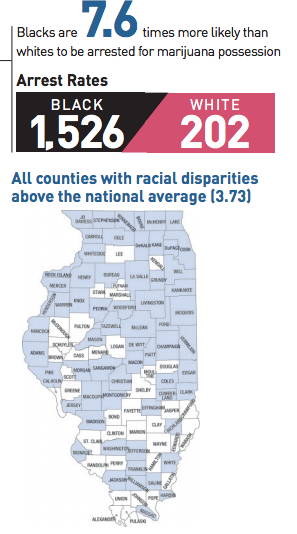 The state by state reports also contain pie charts showing the percentage of all drug related arrests that are for marijuana possession. With all the graphs in the report it could easily be used as an example in a quantitative methods course or some of the figures could be extracted to test the students’ quantitative literacy in reading charts and graphs.
Deviance is socially constructed and the policing of certain types of deviance have real consequences for people. Additionally, that policing continues to impact African Americans more than whites despite similar rates of, in this case, marijuana use.
Students may believe that being if you are arrested that means you were violating the law. Arrests have more to do with the presence of police in the community, the public nature of some communities socializing versus the private nature of others, and who is suspected of being criminal.
Teach well. It matters.
Comments 6
Todd Beer — July 31, 2013
Thanks! I am not yet doing guest posts but what did you have in mind?
Oneilquie Stewart — November 25, 2016
Staying alert with the news is every important.
Oneilquie Stewart — November 25, 2016
Staying alert with your daily news is very important. Because lots of important topics and thing that are beneficial to different race are aired.
TOOLS FOR TEACHING SOCIOLOGY: Teach well. It matters. - Sociology Toolbox — April 18, 2017
[…] THE WAR ON DRUGS: RACE MATTERS The war on drugs impacts people differently based on race. The rate of drug use among populations does not correspond to the rate of incarceration for drug use. Many students often assume that the higher rate of African American males in US prisons is simply a reflection of higher rates of crime. After all, it is called the justice system. An extensive report by the ACLU provides a short video, graphic presentations of the data, and a pdf of the full report on marijuana use and arrest rates among blacks and whites. […]
POLICE KILLING OF BLACKS: Do Black Lives Matter? - Sociology Toolbox — May 27, 2020
[…] resulting in mass incarceration even though whites and blacks report similar rates of drug use (see here and here). Racial profiling has been documented in traffic stops (a.k.a. “driving while […]
POLICE KILLING OF BLACKS: Do Black Lives Matter? | William Anton Lee [Notebook] — June 23, 2020
[…] resulting in mass incarceration even though whites and blacks report similar rates of drug use (see here and here). Racial profiling has been documented in traffic stops (a.k.a. “driving while black”, […]