Course Guide for
SOCIOLOGY OF SPORTS
(last updated 4/2012)
Developed by J.A. Carter
University of Cincinnati
History
- Social Hygiene and the Gender of Health in 1922
- Vintage Women’s Basketball Teams: So Funny!
- Chance, Innovation, and the Evolution of Skateboarding
- Woman Wears Men’s Clothes to a Prizefight World Gasps 1910
- 1927 Wimbledon Ad Using Women’s Progress to Sell
Culture
- Sociologist Doug Hartman on Why We Love Football
- Context: How do you Play Football?
- Brit Hume: Only Christianity Can Save Tiger Woods
- Arizona’s Prayer at the Super Bowl
- What Does it Mean to Believe that a Human Characteristic is Natural?
Fans
Stadiums/Economics
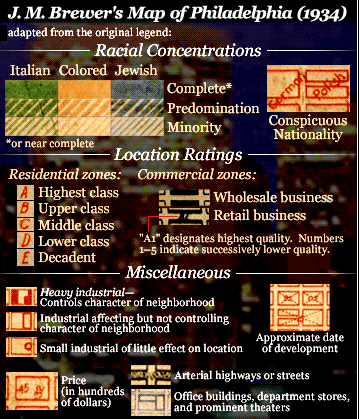
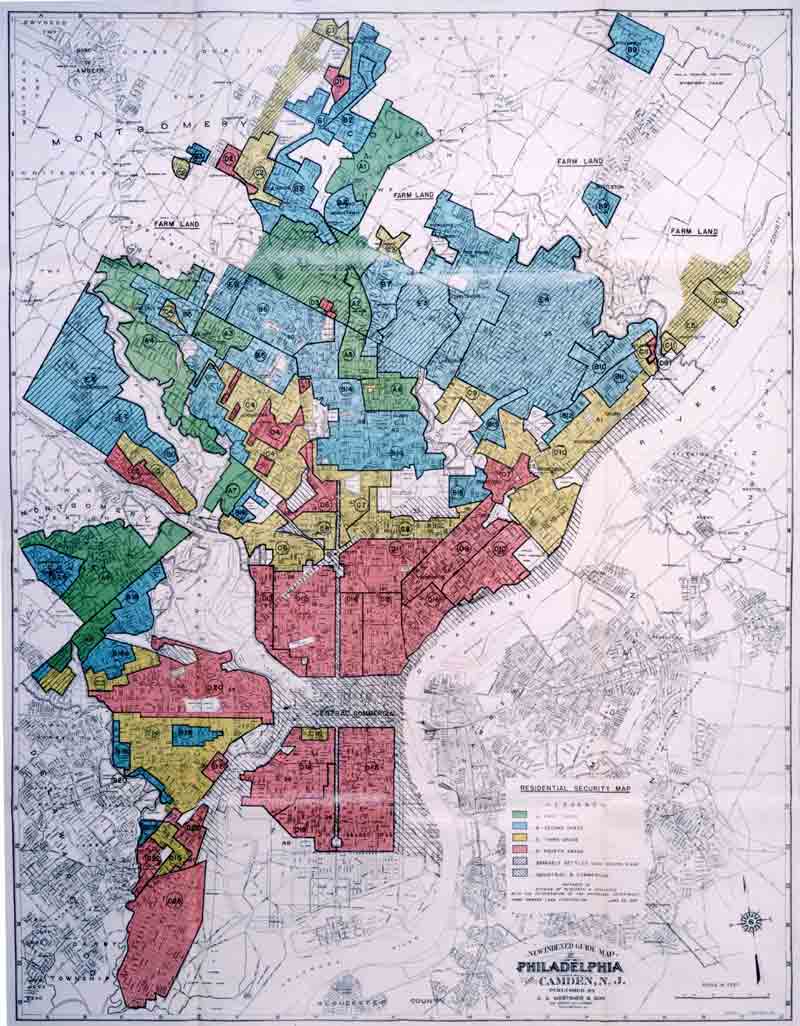
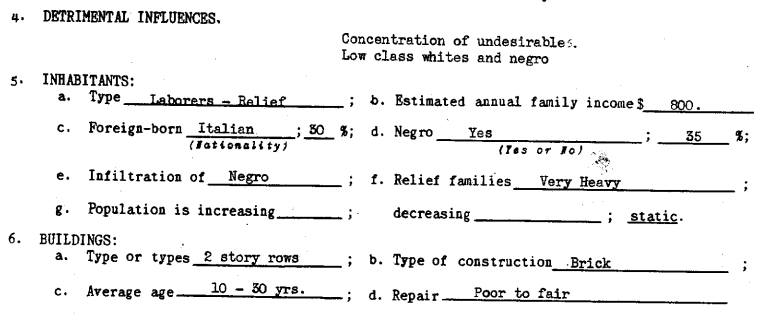
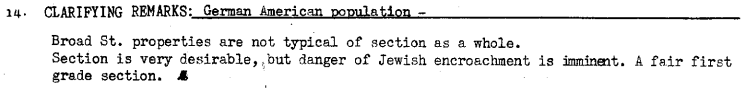
Race/Ethnicity
- Distracted by “Linsanity”: Hidden Racism and the Model Minority Stereotype
- Jeremy Lin, ESPN says, has a “Chink in the Armor”
- Racial Stereotyping and Perceptions of Competence
- Tragedy at Red River: Race, Privilege and Learning to Swim
- Racism and Jingoism Among US Soccer Fans
- When Whiteness Matters in Sport
- Media, Race, & Web 2.0
- An Indigenous Olympics
- Russian Ice Skaters Impersonate Aboriginals, Win Gold
- Orientals v. Gauchos: Who are you Rooting for?
- Dutch Soccer Club Nicknamed the Jews
- Notre Dame’s Fighting Irish Mascot
- Some Native American Sports Mascots
- Don’t Olympic Athletes have Other Things They Need to be Doing
- Olympians Making “Chinese Eyes”
- Arab Women and 2008 Olympic Athletes
- “The Angry Black Athlete”
- Race and the King Kong Motif
- Southern Hospitality?
- Corporate Plantation
Gender
- The Manly Origins of Cheerleading
- Women and Exclusion from Long Distance Running
- Policing Gender in Figure Skating
- I Wonder How Much Laundry the Average Team USA Dad will Do
- Happy Super Bowl Day!
- Barbie and GI Joe: Inscribing Gender Norms on Toys
- Which Women Play on the Center Court at Wimbledon?
- Skate Canada gets “Tough”
- Participation in High School Sports by Gender and Sport
- The Sexualization of Female Olympiads
- Breakfast and Lunch and Dinner of Olympic Champions
- “Come to the Ball”: Swiss Soccer Ad
- Valuing Dads in the WNBA
- Blaming Jessica Simpson: Women Sap Men’s Strength
- Pink Sports Team Clothing: Making a Masculine Arenas Safe for Women
Sex Differences in Sports
- Opportunity and Athletic Performance
- Male as the Neutral Default
- The Question of Caster Semenya’s Sex
Equipment differences in sports
- Female Boxers may be Required to Wear Skirts
- Ideology, Safety, and the Lingerie Football League
- The Amazing Disappearing Cheerleading Outfit
- Femininity and the Proposed Badminton Dress Code
- Two Fun Facts About Figure Skating Fashion
Masculinity
- Hegemonic Masculinity in Super Bowl Commercials
- No Man’s Land and the Alice Band
- Mocking Men with Femininity
- The Daintification of Masculinity
- Men without Sports Knowledge/Skills are Inadequate Human Beings
- Energy Drinks and Violent Masculinity
- Crossing Gender Lines: Boys Doing Double Dutch
- A Set of Ads Suggesting that Men must Eschew Femininity or Else
- Social Construction and Hegemonic Masculinity
Sexuality/Homophobia
- Pushing Back Against Homophobia in Sports
- “Powder Blue Faggots”: More Sporting Homophobic Taunts
- Yankee Fans Verbally Assault Teenage Red Sox Fans with Homophobic Taunts
- What Does a “Prehomosexual” Look Like?
- Johnny Weir: That’s Gay
- Pulled Homophobic Nike Ads
- “Homosexual” vs. “Gay”: Discourse in the Culture Wars
- You’re a Quarterback for SC? That’s So Gay!
Bodies
- Tim Tebow and the Religious Body (Politic)
- Disabled Bodies and Ableist Acceptance
- World Champion Olympic Medalist Reduced to Woman on a Diet
- Objectification of Women = Go Team!
- Idealizing Shawn Johnson
- Re-Framing Menstruation
- Ski Jumping’s Weight Problem
- An Entitlement to the Right to Define and Consume Female Beauty
- Nude Calendar Images of German Paralympic Athletes
- Release the Thin Athletic Body Trapped Inside your Big Fat One
- The Male Gaze Does Not Allow for Boy Nipples
- Men’s Bodies are Allowed to Grow Up
Media
- What’s Important About Female Athletes?
- “Come for the Ladies, Stay for the Legends”
- Serena Williams’ Patriarchal Bargain
- Female Athletes Support the Guys
- His and Hers Sports Illustrated Covers
- SportsCenter, the Predictable Gender Trend
- Cheerleader Dreams at Mattress World
- ESPN Introduces Website for Women
- Women Talk, Eat at Baseball Game; Earth Stands Still
- Welcome, Women to your Special Section
- It’s the Ironman, Not the Ironwoman, so Shut your Cereal Hole
- A Breakdown of Televised Football Broadcasts
- Feminizing Women’s Sports Teams
- It’s so Boring to Wait While your Wife shops for you
- Serena Williams on the Cover of ESPN
- Another Collection of Gender-and-Tech-Related Images
- Female Athletes: Be Pretty, but Not Sexy or Pregnant
- Bringing People Together with Coke
- Marketing Sports Supplement to Men and Women
- Media Portrayals of Female Athletes
- Connecting Golf and Sex
- Score Big at Sports Bar
Violence
College Athletics