Search results for The

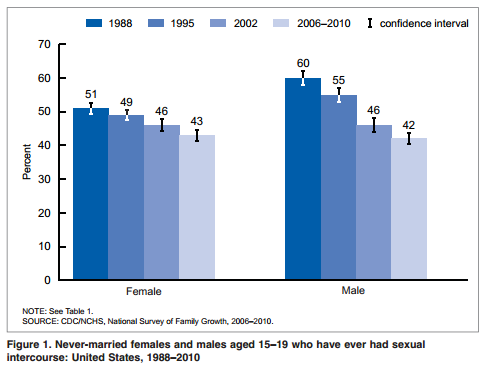
In a fantastic editorial in the New York Times, sociologist Amy Schalet interprets new data from the CDC that shows that young men and women are now losing their virginity at about the same age.  Never-married males between aged 15-19 have essentially the same probability of being a virgin as females:

Schalet draws on her own research comparing American and Dutch teenagers to explain this trend, citing fear and love.  Regarding fear, she writes:

…I found that American boys often said sex could end their life as they knew it. After a condom broke, one worried: “I could be screwed for the rest of my life.” Another boy said he did not want to have sex yet for fear of becoming a father before his time.

The other reason for the increase in the age of virginity loss among boys is romance.  Even in the face of cultural narratives that tell boys that all they want is sex, they tell personal stories of love and emotional connection (yes, even to grown-up lady sociologists).  This loosening of rigid gender roles can be credited to feminism, Schalet contends, and even if it has “largely flown under the radar of American popular culture,” it is nonetheless given boys the “cultural leeway to choose a first time that feels emotionally right.”

For more about Amy Schalet’s research, see Consequences of U.S. and Dutch Approaches to Teen Sex and Talking Sex, Relationships, and Teen Health with Amy Schalet.

Lisa Wade, PhD is an Associate Professor at Tulane University. She is the author of American Hookup, a book about college sexual culture; a textbook about gender; and a forthcoming introductory text: Terrible Magnificent Sociology. You can follow her on Twitter and Instagram.

P. Mae Cooper sent in a report from the Center for Economic and Policy Research that looked at economic insecurity in the U.S. Using data from the Census Bureau’s Annual Social and Economic Supplement, the authors calculate the percentage of good jobs in each state. They define a good job as one that pays at least $17/hr (the inflation-adjusted median income for men in 1979), which for a full-time year-round worker would mean an annual income around $35,000, and which provides health insurance and retirement benefits. Overall, about 1 in 4 jobs fit this definition of a good job, with quite a bit of variation by state:

The data was for 2003-2005, so this doesn’t reflect any effect of the recession on the types of jobs available.

They also calculated the % of jobs that don’t meet any of the elements of a good job — that is, they pay under $17/hr, they don’t provide health insurance, and they don’t have any retirement plan available. These are more common than good jobs, making up about a third of all jobs in the typical state:

One criticism of the official poverty line is that it doesn’t account for regional differences in cost of living, as well as supplementary forms of income supports (Social Security, unemployment, etc.). The authors used Survey of Income and Program Participation data to calculate economic insecurity by taking into account regional costs of living.

The calculations include data for 1) working families and 2) only those families that have 1 or 2 adults and o to 3 children, so it excludes families where not adults are employed or that have 4 or more children. And the data are for 2001-2003, so again, it doesn’t reflect the recession. This map shows the % of the included families whose total income is less than the basic budget standard (that is, actual market costs of essential goods and services in over 400 localities) where they live. About 22% of families were economically insecure, with a lot of variation by state:

I really hope someone updates this analysis, given the recession, but the report provides a general illustration of an important aspect of our economy, and the limitations of a measure of poverty that entirely ignores regional costs of living.

In 1970, the U.S. Census added a “country of origin” question to its demographics section, which asks respondents if they are “of Hispanic, Latino, or Spanish origin.” But a new Pew Hispanic Center report indicates that, while these might be the official terms for those from Spanish-speaking countries and/or Latin America, they aren’t the preferred or most popular labels among those they’re supposed to identify. Only about 1 in 4 use the terms Hispanic or Latino most frequently to describe themselves:

Not surprisingly, identification with different labels differs among recent immigrants and those born in the U.S. Among the first generation, country of origin is the overwhelming preference, but by the third generation, just over 1 in 4 choose that as their most common self-identifier:

Most respondents had no preference between the terms Hispanic or Latino, but for those who did, Hispanic was more popular:

White was the most commonly-chosen racial identification:

Most respondents also said that while they think it’s important that Hispanics be able to speak Spanish in the U.S., that learning English is very important for success. By the second generation, almost all rate themselves as knowing English “pretty” or “very” well:

Conversely, among third-generation Hispanics, under half say they speak or read Spanish equally well:

Check out the full report for tons of additional information on identification, language use, etc.

Norton Sociology recently posted an image that illustrate differences in rates of imprisonment in a number of countries. Imprisonment rates are influenced by a number of factors — what is made illegal, how intense law enforcement efforts are, preference for prison time over other options, etc. The U.S. does not compare favorably, with 74.3 per 100,000 10,000 of our population behind bars (click here for a version you can zoom in on, and sorry for the earlier typo!):

Here’s a close-up of the breakdown of the U.S. prison population:

Via Urban Demographics.

If plain ol’ chocolate isn’t exciting enough this Easter, try:

Lisa Wade, PhD is an Associate Professor at Tulane University. She is the author of American Hookup, a book about college sexual culture; a textbook about gender; and a forthcoming introductory text: Terrible Magnificent Sociology. You can follow her on Twitter and Instagram.

It is Easter Sunday. How about other places on the globe such as Japan? Christians are less than 1% of the population of Japan.  Yet, because of globalization, geographic locations plays less and less of a role in defining culture.  Many people around the world now consume the same food, clothing, music, movies, and technology.

Global corporations play a role in transmitting culture from place to place.  Recently, American corporations in Japan have been trying to popularize and commercialize Easter.  Disney’s theme park in Tokyo, for example, has promoted Easter with the Disney Easter Wonderland since 2010:

Likewise, beginning last year, Baskin Robbins has been promoting the holiday.  This year they have a month-long Wonderful Easter Campaign:

It will be very interesting to see how Easter becomes part of Japanese culture.  When the Japanese adopted Valentine’s day, for example, they added their own twist.  Women are expected to give chocolate to men; men are supposed to return the favor by giving candy to women on March 14th, White Day.  I would not be surprised to find that Easter becomes popular in Japan, but celebrated with a twist – a Japanese flavor.

—————————

Sangyoub Park is an assistant professor of sociology at Washburn University, where he teaches Social Demography, Generations in the U.S. and Sociology of East Asia. His research interests include social capital, demographic trends, and post-Generation Y.

Recently we posted a comparison of the types of jobs Americans held in 1940 and 2010, based on Census data. Now NPR has posted an interesting image showing how spending on different categories has changed:

Source: Bureau of Labor Statistics. Credit: Lam Thuy Vo / NPR

[Note: Sorry I initially accidentally left out the link to the original NPR story!]

The change in spending on food is especially noteworthy, given the role that cost of food plays in determining the poverty line in the U.S. It is still based on a calculation developed in the 1960s, which assumed that the average family spent about a third of its income on food. To figure out how much a family needed to survive, the minimum cost of a nutritionally-complete diet for a particular family size was calculated; multiplying it by three provided the poverty line. It was then adjusted over time. This is the number generally used to determine eligibility for government assistance programs.

But since then, food prices have fallen significantly, while other necessities, such as housing and medical care, have often gotten more expensive. Many have criticized the poverty line calculation, including the National Academy of Sciences, arguing that as food has gotten cheaper, the official poverty line does a worse and worse job of capturing exactly how much it costs to survive in the U.S.

NPR also provided a more detailed breakdown of spending on a number of major categories in 2011:

Source: Bureau of Labor Statistics. Credit: Lam Thuy Vo / NPR

Thanks to my friend Kathy B. for letting me know!

Anderson Cooper 360 posted a video based on a study they sponsored of kids’ perceptions of race and friendships. The results are not surprising: kids pick up on larger social patterns, such as the fact that the adults around them often have few significant friendships across racial lines, and struggle to make sense of what they see. By age 6 they are highly aware of race and have formed clear ideas about how adults feel about people of other races than their own. Moreover, they’ve internalized cultural messages about race. As the clip shows, the race of the children themselves, as well as the race of children in images they are shown, impacts how they interpret the events in the pictures, with White children attributing more negative behaviors to African Americans in the photos:

Also check out Anderson Cooper’s earlier segments on children’s attitudes about skin color.