Search results for The

Cross-posted at Reports from the Economic Front.

Congress has finally agreed on a deficit reduction plan that President Obama supports. As a result, the debt ceiling is being lifted, which means that the Treasury can once again borrow to meet its financial obligations.

Avoiding a debt default is a good thing. However, the agreement is bad and even more importantly the debate itself has reinforced understandings of our economy that are destructive of majority interests.

The media presented the deficit reduction negotiations as a battle between two opposing sides. President Obama, who wanted to achieve deficit reduction through a combination of public spending cuts and tax increases, anchored one side. The House Republicans, who would only accept spending cuts, anchored the other. We were encouraged to cheer for the side that we thought best represented our interests.

Unfortunately, there was actually little difference between the two sides in terms of the way they engaged and debated the relevant issues. Both sides agreed that we face a major debt crisis. Both sides agreed that out-of-control social programs are the main driver of our deficit and debt problems. And both sides agreed that the less government involvement in the economy the better.

The unanimity is especially striking since all three positions are wrong. We do not face a major debt crisis, social spending is not driving our deficits and debt, and we need more active government intervention in the economy, not less, to solve our economic problems.

So what was the deal?

Before discussing these issues it is important to highlight the broad terms of the deficit reduction agreement. The first step is limited to spending cuts; discretionary spending is to be reduced by $900 billion over the next ten years. Approximately 35% of the reduction will come from security-related budgets (military and homeland security), with the rest coming from non-security discretionary budgets (infrastructure, energy, research, education, and social welfare). In exchange for these budget cuts the Congress has agreed to raise the debt ceiling by $1 trillion.

The agreement also established a 12 person committee (with 6 Democrats and 6 Republicans) to recommend ways to reduce future deficits by another $1.2-1.5 trillion. Its recommendations must be made by November 23, 2011 and they can include cuts to every social program (including Social Security, Medicare and Medicaid), as well as tax increases.

Congress has to vote on the committee’s package of recommendations by December 23, 2011, up or down. If Congress approves them they will be implemented. If Congress does not approve them, automatic cuts of $1.2 trillion will be made; 50% of the cuts must come from security budgets and the other 50% must come from non-security discretionary budgets. Regardless of how Congress votes on the recommendations, it must also vote on whether to approve a Balanced Budget Amendment to the Constitution. Once this vote is taken, the debt ceiling will be raised again by an amount slightly smaller than the deficit reduction.

Check out this flowchart from the New York Times if you want a more complete picture of the process.

Why is this a problem?

Those who favor reducing spending on government programs generally argue that we have no choice because our public spending and national debt are out of control, threatening our economic future. But, the data says otherwise.

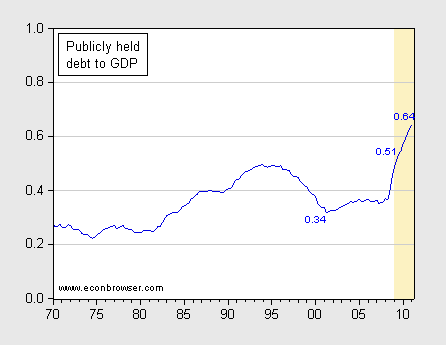
The chart below, from the economist Menzie Chinn at Econbrowser, shows the movement in the ratio of publically held debt to GDP over the period 1970 to 2011; the area in yellow marks the Obama administration. While this ratio has indeed grown rapidly, it remains well below the 100% level that most economists take to be the warning level. In fact, according to Congressional Budget Office predictions, we are unlikely to reach such a level for decades even if we maintain our current spending and revenue patterns.

The sharp growth in the ratio over the last few years strongly suggests that our current high deficits are largely due to recent developments, in particular the 2001 and 2003 Bush tax cuts, the wars in Iraq and Afghanistan, and the Great Recession. Their contribution can be seen in this chart from the New York Times.

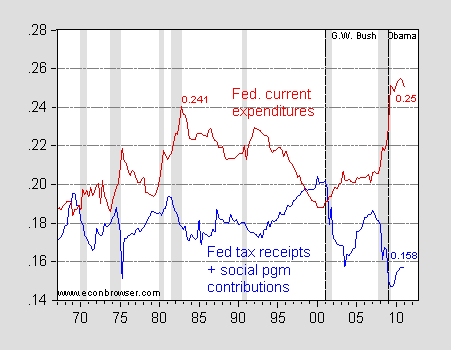
The effects of the tax cuts and economic crisis on our deficits (and by extension debt) are especially visible in the following chart (again from Menzie Chinn), which plots yearly changes in federal spending and federal revenue as a percentage of GDP (the shaded areas mark periods of recession). As we can see, the recent deficit explosion was initially driven more by declining revenues than out of control spending. Attempts to close the budget gap solely or even primarily through spending cuts, especially of social programs, is bound to fail.


To summarize:

Tragically, the debate over how best to reduce the deficit has encouraged people to blame social spending for our large deficits and those large deficits for our current economic problems.  As a result, demands for real structural change in the way our economy operates are largely dismissed as irrelevant.

Recent economic data should be focusing our attention on the dangers of a new recession.  According to the Commerce Department our economy grew at an annual rate of just 1.3% in second quarter of this year, following a first quarter in which the economy grew by only 0.3%.  These are incredibly slow rates of growth for an economy recovering from a major recession.  To put these numbers in perspective, Dean Baker notes that we need growth of over 2.5% to keep our already high unemployment rate from growing.

Cutting spending during a period of economic stagnation, especially on infrastructure, research, and social programs, is a recipe for greater hardship.  In fact, such a policy will likely further weaken our economy, leading to greater deficits.  This is what happened inthe UK, Ireland, and Greece—countries with weak economies that tried to solve their deficit problems by slashing public spending.

We need more active government intervention, which means more spending to redirect and restructure the economy; a new, more progressive tax structure; and a major change in our foreign policy, if we are going to solve our economic problems.  Unfortunately for now we don’t have a movement powerful enough to ensure our side has a player in the struggles that set our political agenda.


Cross-posted at Family Inequality.

The news each month is usually on unemployment rates, weekly filings of new claims, layoffs and new hiring. And the Pew report on widening race/ethnic wealth gaps was eye-opening. But you can take the measure of the recession overall maybe best with the employment rates — how many people have jobs? By that measure, the news is flat-to-down without letup. The Black-White discrepancy in the trends is increasing.

Here is the employment trend for White and Black women, showing that Black women had higher employment rates before the recession, but they’ve fallen more than twice as much as White women’s (a drop of 5.7% versus 2.4% as of June):

Source: Bureau of Labor Statistics data.

For men, the gap is bigger and the lines further apart, so I added a ratio line to help show the gap. Black men’s rate has fallen 5.6%, compared with 3.8% for White men:

The Christian Science Monitor has an article reviewing some of the factors that contribute to the unemployment gap for men, including education, incarceration and discrimination. And the Center for American Progress has more detail in this report, which argues that declines in manufacturing and public employment are increasing the Black-White gaps especially in this recession.

What the broader statistics don’t show as well is the tenuousness of the jobs Black workers have compared to Whites generally — working for weaker firms, in more segregated jobs, as a result of a racialized sorting process, which put them at higher risk of job loss in a recession (even without discrimination in firing decisions, which there is, too).

Today, the field of computer science is heavily male-dominated — men earn the vast majority of undergraduate and Ph.D. degrees in the field. But this wasn’t always true. When computers were first developed, we weren’t sure what kind of job programming was, whether a highly technical scientific occupation or a more secretarial-type one akin to being a typist. The fluidity of the developing field initially attracted significant numbers of women.

Anjan G. sent in an example of the normalization of computer programming as a female occupation, posted at Fog Creek. This article appeared in a 1967 issue of Cosmopolitan and quotes computer scientist Dr. Grace Hopper, a pioneer in the field, discussing why programming is a perfect fit for women — by drawing partly on gender stereotypes by assuming women are “naturals” at programming because they’re patient and pay attention to details:

You can find a larger image here.

Also, if you’re interested, Fog Creek, a software company, looked at their own data to see if male and female job applicants have equal chances of getting hired, and they posted an interview with the only woman working on their technical staff, an intern.

Back when we were kind of obsessed with “man” and “woman” symbology — e.g., whether traffic lights ever include female figureshow stick figures tend to be male, unless they’re parenting, the weird world of default avatars, and also this interesting alternative symbol for disability — I had considered writing a post featuring the then-stewardess, now-flight attendant icon seen on airplanes.  Airplanes have a longer life than cars and, so, many of the airplanes operated by commercial companies still have the old stewardess icon: a friendly round head with a dress.  These were old planes though, I figured, so the post wouldn’t pack much of a punch. They were like that, back then, after all.

Lo and behold, MirandaB took a flight on Delta and snapped a photograph of an undeniably modern incarnation of the friendly round head:

Delta chose to use a digitally-skirted stick figure on its task screen.  Just to be clear, Delta still, in 2011, feels comfortable representing “flight attendants” as 100% female.  That’s a win with the language, a fail with the symbology.

According to the Bureau of Labor Statistics, women account for 81% of flight attendants, not 100% by a long shot.  But you can see why men might be reluctant to join their ranks.

Also in gender, sexism, and air travel: Sexism in Aviation, Then and Now, Selling Feminine Passivity, “Singapore Girls” and Emotion Work, and Fly the Unfriendly Skies.

Lisa Wade, PhD is an Associate Professor at Tulane University. She is the author of American Hookup, a book about college sexual culture; a textbook about gender; and a forthcoming introductory text: Terrible Magnificent Sociology. You can follow her on Twitter and Instagram.

The Pew Research Center just released an analysis of 2009 government data on the wealth gap between White non-Hispanics, African Americans, and Hispanics, and it’s pretty depressing. It’s not just that the gap is so large, but also that Hispanic and African American households have such low median worth in absolute terms (p. 13 in the report):


A quarter of Hispanics and Blacks have no assets other than a vehicle, compared to 6% of Whites. And 35% of Black and 31% of Hispanic households had negative median net worth in 2009, with their debts outweighing all of their assets; this was true of only 15% of White non-Hispanics.This is partially because African Americans and especially Hispanics were disproportionately hit by the effects of the housing crisis, the single largest source of reduced wealth. Overall, those two groups have suffered a much more dramatic loss in assets than Whites (sorry, Asians weren’t included in all the images, and Native Americans aren’t included in any):

The result is a wealth gap that is the largest it has ever been since the government began making such data available in the early ’80s. White non-Hispanics have nearly 20 times higher median wealth than Blacks, and 15 times as much as Hispanics:

For more details, check out the full report. The implications of these disparities, and the low levels of financial assets available to African Americans and Hispanics compared to Whites, is truly stunning.

Tijana Mamula has put together a 50-minute video presenting all of the portrayals of gays and lesbians in ten seasons of the sitcom Friends. Her aim is to illustrate not just the homophobia, but the ease with which gently homophobic humor pervades the series. She writes:

The homophobic jokes, as they appear in the original series, are never violent and most often are not even openly denigratory; rather, they purport to offer an honest and “good-humored” representation of a common, socially sanctioned stance towards homosexuality. Situated within the wide array of jokes in any single episode, this homophobia tends to avoid provoking either aversion or anger, and instead prompts the viewer to be swept away by the hilarity of the situations.

It’s worth watching at least a few minutes:

Via Political Remix Video.

Lisa Wade, PhD is an Associate Professor at Tulane University. She is the author of American Hookup, a book about college sexual culture; a textbook about gender; and a forthcoming introductory text: Terrible Magnificent Sociology. You can follow her on Twitter and Instagram.

Mandi B. sent in this straightforward example of the way that women are positioned as commodities in advertising.  The email ad for Spirit Airlines reads “Trade Up for a Better Flight Awards Card” and illustrates that trade with a new car, a younger look, and a lady in red.  What does the lady have to do with it? Absolutely nothing. But it works because we’re accustomed to thinking of sexy women as prizes for men’s success.

Lisa Wade, PhD is an Associate Professor at Tulane University. She is the author of American Hookup, a book about college sexual culture; a textbook about gender; and a forthcoming introductory text: Terrible Magnificent Sociology. You can follow her on Twitter and Instagram.

Cheerleading started in the United States in the late 19th century as a male activity whose purpose was to organize crowds cheering at football games.   In 1923, women joined cheerleading squads and have increasingly dominated this sport.  Cheerleading traditionally features chanting, gymnastics, and tumbling.  The dominant image of cheerleaders  is a perky, always smiling, female who fits a particular body mold.

However, in the late 1970s, a new style of cheerleading emerged in North Carolina and Virginia.  This African American originated style of cheerleading is called “Stomp n Shake”.  Stomp n Shake cheerleaders have the same goals as “traditional cheerleaders” — to motivate their sports team and raise the enthusiasm of fans. However, Stomp n Shake uses African American dance/stepping aesthetics and African American bragging and insult traditions (dozens/snapping) to “pump up” their audience.  Some Stomp n Shake squads include tumbling and stunts in their repertoire, while other squads don’t.  Mostly women, Stomp n Shake cheerleaders rarely smile.  Instead their goal is to look serious and intimidating when they are chanting their cheers and performing their cheer routines.  As the name implies, hip and butt shaking are common features of Stomp n Shake routines, something usually disallowed in most mainstream competitive cheerleading.

Virginia State University Woo Woos (Work It…):

Howard University Bison Cheerleaders:

Prince Edward County High School, SASSY (We Shake The Best):

It’s also interesting to note that Stomp n Shake cheerleading squads  appears to be more accepting of cheerleaders who don’t fit the relatively slender body build of mainstream cheerleaders.  Comment threads for YouTube videos of usually include comments that certain squad members are overweight and therefore should not be cheerleaders.   Usual responses to those comments are that a “thick”(big boned) body frame is common for many Black females, and, besides,  a cheerleader’s weight has nothing to do with her cheerleading skills.

Stomp n Shake is changing the way cheerleading is performed in the United States and elsewhere, often to the dismay of many cheerleading coaches, cheerleaders, and fans who very much prefer that cheerleading remain the way it is.  However, the influence of such movies as the Bring It On cheerleader series (five movies from 2000-2009) and the posting of videos on YouTube — along with the desire of cheerleading squads to be cutting edge and “hip”– have already influenced the performance styles of some more “traditional” cheerleading squads.  It will be interesting to see whether Stomp n Shake cheerleading will also increase the acceptance in mainstream cheerleading for cheerleaders whose physical builds  are different than those of the typical cheerleader in the past and the present.

Azizi Powell earned a B.A. in sociology from Upsala College, East Orange New Jersey.  She is a retired health & human services administrator, a mother and grandmother, and a free lance artist (African storyteller).  She curates two cultural websites Cocojams and Jambalayah.  For more information and videos on Stomp n Shake cheerleading, click here.