Search results for survey

“How could we get evidence for this?” I often ask students. And the answer, almost always is, “Do a survey.” The word survey has magical power; anything designated by that name wears a cloak of infallibility.

“Survey just means asking a bunch of people a bunch of questions,” I’ll say. “Whether it has any value depends on how good the bunch of people is and how good the questions are.”  My hope is that a few examples of bad sampling and bad questions will demystify.

For example, Variety:

11

Here’s the lede:

Despite its Biblical inspiration, Paramount’s upcoming “Noah” may face some rough seas with religious audiences, according to a new survey by Faith Driven Consumers.

The data to confirm that idea:

The religious organization found in a survey that 98% of its supporters were not “satisfied” with Hollywood’s take on religious stories such as “Noah,” which focuses on Biblical figure Noah.

The sample:

Faith Driven Consumers surveyed its supporters over several days and based the results on a collected 5,000+ responses.

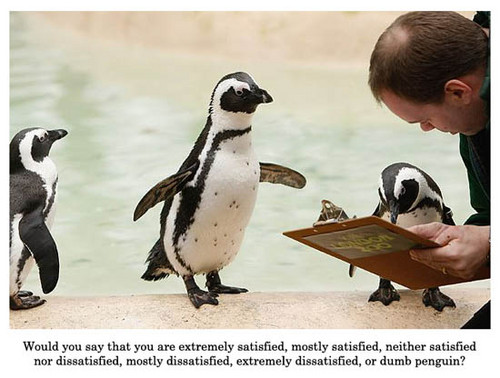
And (I’m saving the best till last) here’s the crucial survey question:

As a Faith Driven Consumer, are you satisfied with a Biblically themed movie — designed to appeal to you — which replaces the Bible’s core message with one created by Hollywood?

As if the part about “replacing the Bible’s core message” weren’t enough, the item reminds the respondent of her or his identity as a Faith Driven Consumer. It does make you wonder about that 2% who either were fine with the Hollywood* message or didn’t know.

You can’t really fault Faith Driven Consumer too much for this shoddy “research.” They’re not in business to find the sociological facts. What’s appalling is that Variety accepts it at face value and without comment.

Cross-posted at Montclair SocioBlog.

Jay Livingston is the chair of the Sociology Department at Montclair State University. You can follow him at Montclair SocioBlog or on Twitter.

Sangyoub Park let us know that the Bureau of Labor Statistics has released the results of the 2010 American Time Use Survey, a study that looks at what we do with our time. They haven’t released any charts of the 2010 data yet, but the Wall Street Journal posted an article with an image that summarizes the changes since 2007, before the recession began. Not surprisingly, on average Americans are spending less time working and more time sleeping and watching TV, among other activities:

Keep in mind those numbers are daily averages that even out activity that is often not evenly distributed in real life (such as work, where weekly hours worked are averaged across all 7 days).

These changes seem insignificant when you look at them; so what if Americans are, on average, sleeping 5 extra minutes a day, or spending 2 minutes less buying things? But when aggregated across the entire U.S. population aged 15 years or older, these add up to major shifts in family and work life as well as economic activity.

There’s a video to accompany the story:

Finally, they have an interactive website where you can enter your own time use in major categories (to the best you can estimate it) and see how you compare to national averages.

We’ll follow up with more detailed posts once the BLS starts posting relevant charts.

Dimitriy T.M. let us know about the Bureau of Labor Statistics American Time Use Survey website, which has lots of fascinating information. The ATUS data for 2009 was just released but they don’t have charts available yet, so I’m presenting data from 2008 here.

This shows daily time spent in various activities for women who are married and have children under 6 living in the home, by their employment status:

They didn’t provide a similar breakdown for married men, oddly.

Hours spent daily on household chores, by sex (but not broken down by employment status):

The difference in hours spent on household activities is interesting, but since it’s not broken down by employment, and women are less likely to be employed full-time than men, it doesn’t really tell us to what degree this is women doing a “second shift” vs. household management as their primary activity, so that’s sort of annoying.

Volunteer activity by sex and age (notice that the columns represent the average daily % of the population who volunteered, not the number of hours they spent volunteering, and the data is an average for 2004-2008):

This isn’t surprising, given that social scientists have generally found that women do more volunteer work, more regularly, than men (again, I’d like to see this broken down by employment status).

It’s also interesting that men and women who volunteer tend to do different types of activities. As this graph shows, it mimics the indoor/outdoor household chores pattern we see in family life. Women are more likely to do food preparation, while men are more likely to do maintenance. Also, men seem somewhat more likely to have leadership positions or to attend skills-building activities, while women do organizational stuff:

For both men and women, volunteering is most common for those with school-aged children in the household, indicating that a lot of volunteering is probably for child-centered organizations such as sports teams and PTA meetings:

I was somewhat surprised by the relationship between volunteering and educational level. The percent of people who volunteer goes up with more education, but the hours spent volunteering per day goes down:

Though the daily difference isn’t huge (just a half hour less for those with a 4-year college degree and those with less than a high school degree), over the course of a month or year it would certainly add up.

If you go through the raw data files, I’m sure there are all types of interesting relationships that give more detailed information about sex, employment status, and time usage. A fun way to waste time if you ever need a procrastination tool.

A recent CBS/New York Times poll reveals how words matter. They asked 500 respondents how they felt about permitting “homosexuals” to serve in the military; then they asked a different 500 how they felt about “gays/lesbians” serving in the military.  It turns out, people like gays and lesbians more than they like homosexuals:

Also in words: frankenfoods, atomic, soda vs. pop, tradition, hispanic, feminism, woman, averagenurse, George Lakoff on metaphor, professional, Jon Steward on re-branding, development, organic, the third world, man vs. girl, natural, honorifics, Africa, dithering, terrorism, the rape and other violent metaphors, and flesh-colored.

And also see our post on the war against “gay.”  (Poll discovered via Montclair SocioBlog.)

Lisa Wade, PhD is an Associate Professor at Tulane University. She is the author of American Hookup, a book about college sexual culture; a textbook about gender; and a forthcoming introductory text: Terrible Magnificent Sociology. You can follow her on Twitter and Instagram.

Via.

Societies grow and change all the time, but it can be tough to think about big-picture shifts when you’re living through the practical details of the day to day. Take the recent popularity of large language models (LLMs). In the short term, we face important sociological questions about how they fit into the norms of everyday life. Is it cheating to use an LLM to help you write, or to generate new ideas? How will new kinds of automation change work, or will they take jobs away?

These are important questions, but it is also useful to take a step back and think about what rapid developments in technology might do to our foundational social relationships and core beliefs. I was fascinated by a recent set of studies published in PNAS that suggest automated work and LLMs could even change the way we think about religion.

“draw an illustration of a church slowly dissolving into a series of zeros and ones, like computer code in The Matrix”

In the article “Exposure to Automation Explains Religious Declines,” authors Joshua Conrad Jackson, Kai Chi Yam, Pok Man Tang, Chris G. Sibley, and Adam Waytz review the findings from five studies. In one, their analysis of longitudinal data across 68 countries from 2006 to 2019 finds nations with higher stocks of industrial robots also tend to have lower proportions of people who say religion is an important part of their daily lives in surveys.

Figure 1 from Jackson et al. (2023) demonstrating nations with a higher stock of industrial robots also express lower rates of religiosity, on average. You can read the full notes at the open-access article here.

I was most surprised by the results of their fifth study—an experiment teaching people about recent advances in science and AI. Respondents who read about the capabilities of LLMs like ChatGPT showed “greater reductions in religious conviction than learning about scientific advances” (8).

The authors suggest one reason for this pattern is that “people may perceive AI as having capacities that they do not ascribe to traditional sciences and technologies and that are uniquely likely to displace the instrumental roles of religion” (2). This is important for us, whether or not you’re personally religious, because religion is a socially powerful force – people use shared beliefs to accomplish things in the world and solve problems, even to cope with hardships like losing a job.

But these results show that new changes in technology, like the advent of LLMs, might be expanding people’s imaginations about what we can do and achieve, possibly even changing the core beliefs that are central to their lives over the long term.

Evan Stewart is an assistant professor of sociology at University of Massachusetts Boston. You can follow his work at his website, on Twitter, or on BlueSky.

As the new year brings in a new peak in COVID cases across the country, we all have a right to feel a little down in the dumps.

One trend picked up by surveys earlier in the pandemic was a drop in self-reported happiness. Now, with a new year of General Social Survey data released, it looks like the trend continues.

Trends in the General Social Survey show a drop in people saying they are "very happy" and a spike in people saying they are "not too happy" in 2021.
Part of this change could also be explained by the survey’s new online administration method, but the pattern is consistent with NORC’s previous pandemic tracking survey.

I’ve been thinking a lot about happiness and wellbeing as I launch into teaching Introduction to Sociology this year, both because we want to do right by our students in a tough time and because new students thinking about majoring have a right to ask us: how is our field helping the world?

That’s why I was especially hopeful to hear about this study making its way around Twitter. The authors conducted interviews and surveys with experts in the field of happiness research to rank the things they thought would be most likely to increase life satisfaction based on their understanding of the research literature. Two important points caught my attention.

First, the researchers ranked both personal solutions and policy solutions to improve life satisfaction. This is important because we often think about our own happiness as an individual experience and an individual effort (often bolstered by the self-help industry). Focusing on policy reminds us that our individual wellbeing is linked to collective wellbeing, too.

Second, many of these experts’ top ranked solutions were explicitly about social relationships. For personal solutions, two of the top ranked suggestions were investing in friends and family and joining a club. For policy solutions, some of the top answers included promoting voluntary work or civil service and reducing loneliness.

Results from the paper show expert consensus that investing in friends and family and joining a club can improve life satisfaction.
It wasn’t just high expert ratings, low expert standard deviations indicated a lot of agreement about the value of social bonds. You can see the full set of results here, and the full paper here.

Expert consensus studies like this have a lot of limitations, since they only show us a glimpse of the current conventional wisdom. But this study also shows us the positive stakes of sociology. It reminds us that developing a better understanding of our relationships and investing in those relationships is not just a self-help fad; it can be a social policy priority to get us through tough times together.

Evan Stewart is an assistant professor of sociology at University of Massachusetts Boston. You can follow his work at his website, on Twitter, or on BlueSky.

We seem to have been struggling with science for the past few…well…decades. The CDC just updated what we know about COVID-19 in the air, misinformation about trendy “wellness products” abounds, and then there’s the whole climate crisis.

This is an interesting pattern because many public science advocates put a lot of work into convincing us that knowing more science is the route to a more fulfilling life. Icons like Carl Sagan and Neil deGrasse Tyson, as well as modern secular movements, talk about the sense of profound wonder that comes along with learning about the world. Even GI Joe PSAs told us that knowing was half the battle.

The problem is that we can be too quick to think that knowing more will automatically make us better at addressing social problems. That claim is based on two assumptions: one, that learning things feels good and motivates us to action, and two, that knowing more about a topic makes people more likely to appreciate and respect that topic. Both can be true, but they are not always true.

The first is a little hasty. Sure, learning can feel good, but research on teaching and learning shows that it doesn’t always feel good, and I think we often risk losing students’ interest because they assume that if a topic is a struggle, they are not meant to be studying it.

The second is often wrong, because having more information does not always empower us to make better choices. Research shows us that knowing more about a topic can fuel all kinds of other biases, and partisan identification is increasingly linked with with attitudes toward science.

To see this in action, I took a look at some survey data collected by the Pew Research Center in 2014. The survey had seven questions checking attitudes about science – like whether people kept up with science or felt positively about it – and six questions checking basic knowledge about things like lasers and red blood cells. I totaled up these items into separate scales so that each person has a score for how much they knew and how positively or negatively they thought about science in general. These scales are standardized, so people with average scores are closer to zero. Plotting out these scores shows us a really interesting null finding documented by other research – there isn’t a strong relationship between knowing more and feeling better about science.

The purple lines mark average scores in each scale, and the relationship between science knowledge and science attitudes is fairly flat.

Here, both people who are a full standard deviation above the mean and multiple standard deviations below the mean on their knowledge score still hold pretty average attitudes about science. We might expect an upward sloping line, where more knowledge associates with more positive attitudes, but we don’t see that. Instead, attitudes about science, whether positive or negative, get more diffuse among people who get fewer answers correct. The higher the knowledge, the more tightly attitudes cluster around average.

This is an important point that bears repeating for people who want to change public policy or national debate on any science-based issue. It is helpful to inform people about these serious issues, but shifting their attitudes is not simply a matter of adding more information. To really change minds, we have to do the work to put that information into conversation with other meaning systems, emotions, and moral assumptions.

Evan Stewart is an assistant professor of sociology at University of Massachusetts Boston. You can follow his work at his website, on Twitter, or on BlueSky.