Dimitriy T.M. let us know about the Bureau of Labor Statistics American Time Use Survey website, which has lots of fascinating information. The ATUS data for 2009 was just released but they don’t have charts available yet, so I’m presenting data from 2008 here.
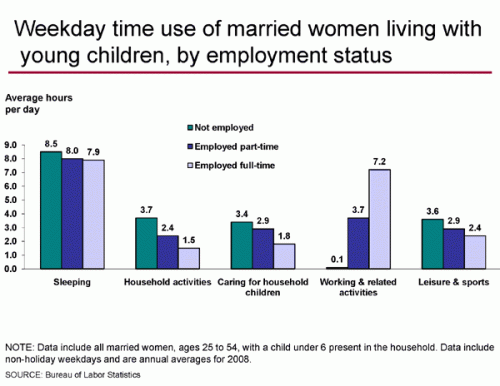
This shows daily time spent in various activities for women who are married and have children under 6 living in the home, by their employment status:
They didn’t provide a similar breakdown for married men, oddly.
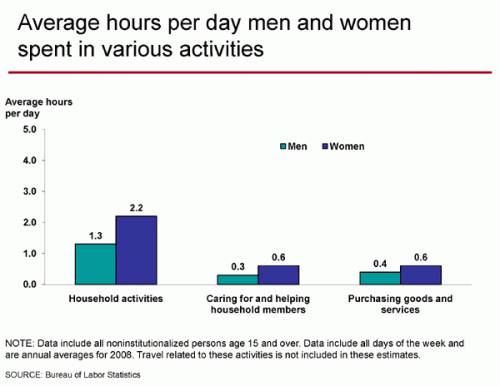
Hours spent daily on household chores, by sex (but not broken down by employment status):
The difference in hours spent on household activities is interesting, but since it’s not broken down by employment, and women are less likely to be employed full-time than men, it doesn’t really tell us to what degree this is women doing a “second shift” vs. household management as their primary activity, so that’s sort of annoying.
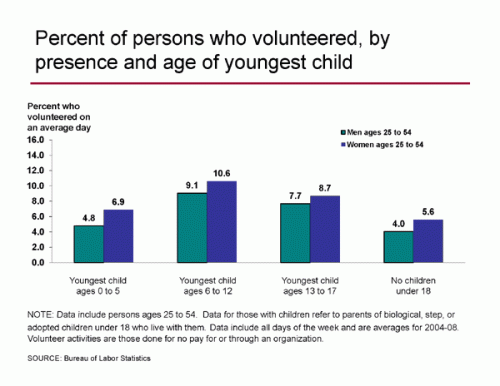
Volunteer activity by sex and age (notice that the columns represent the average daily % of the population who volunteered, not the number of hours they spent volunteering, and the data is an average for 2004-2008):
This isn’t surprising, given that social scientists have generally found that women do more volunteer work, more regularly, than men (again, I’d like to see this broken down by employment status).
It’s also interesting that men and women who volunteer tend to do different types of activities. As this graph shows, it mimics the indoor/outdoor household chores pattern we see in family life. Women are more likely to do food preparation, while men are more likely to do maintenance. Also, men seem somewhat more likely to have leadership positions or to attend skills-building activities, while women do organizational stuff:
For both men and women, volunteering is most common for those with school-aged children in the household, indicating that a lot of volunteering is probably for child-centered organizations such as sports teams and PTA meetings:
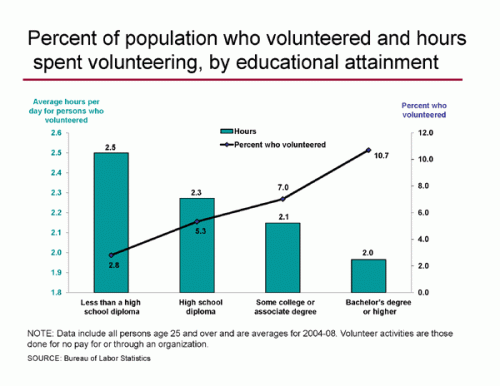
I was somewhat surprised by the relationship between volunteering and educational level. The percent of people who volunteer goes up with more education, but the hours spent volunteering per day goes down:
Though the daily difference isn’t huge (just a half hour less for those with a 4-year college degree and those with less than a high school degree), over the course of a month or year it would certainly add up.
If you go through the raw data files, I’m sure there are all types of interesting relationships that give more detailed information about sex, employment status, and time usage. A fun way to waste time if you ever need a procrastination tool.


Comments 20
Emily — June 24, 2010
Is it wrong that my entire reaction to the first graph is "there are parents of small children who sleep more than eight hours a day?" I struggle to get seven, and that's only because my wife and I alternate mornings with the toddler, which again is only possible because neither of us have set work hours and no one needs to leave the house before 9 almost ever.
I'm also surprised that the spike in over-55 volunteerism isn't reflected in the "children's ages" graph. Hmm, except, looking at the graph, the first chart is % who volunteered on a given day, while the other is % who volunteer overall--so retirees, for instance, might volunteer more days a week, but a smaller percentage total? I'd need to see raw numbers to parse that out, probably...
Maria — June 24, 2010
Am I a terrible person because the first thing I thought about the last graph is that adults who have a low education are more likely to commit petty crimes that require community service of some sort, therefore they have a higher rate of volunteerism?
:/
justcallmejo — June 25, 2010
Three things struck me while reading this:
1) If you are an unemployed married mother living with small children and you only look after your children 3.4 hrs per day, who is looking after them the rest of the 8+ hrs of the day??
2) Am I the only one who thinks 2 hrs EVERY DAY of volunteering seems like a lot? Which leads me to my third thing...
3) In the last graph I wonder if people with Bachelor degrees interpret "volunteering" differently than someone who has less than a high school education. Perhaps what university graduate parents consider volunteering at school is what high school graduate parents would consider simply "being a parent".
Rose — June 25, 2010
It would be interesting to see the volunteering/educational experience graph broken down by those employed and unemployed in each category of educational attainment.
Catholic Tide — June 29, 2010
Found in Rome's catacombs: oldest known images of Apostles...
My blog readers will be interested in your post so added a trackback to it on CatholicTide...
Ping — July 7, 2010
Some Great Tips For Being An Event Photographer...
I found your entry interesting thus I've added a Trackback to it on my weblog :)...
Neil Smith — February 4, 2020
Wait until it finishes the downloading process, https://showbox.run/ then you will have the app in your store.
Smith Sloth — February 4, 2020
Life is a success when to https://dltutuapp.com/tutuapp-download/ you are the greatest of all time.
prepaidcardstatus — August 21, 2020
Your site has a lot of useful information for myself. I visit regularly http://www.prepaidcardstatus.tips/
prepaidcardstatus — August 21, 2020
Thanks for sharing useful post here. http://prepaidcardstatus.tips/
prepaidcardstatus — August 21, 2020
Excellent Artical ! Thank you very much for your hard work prepaidcardstatus
postalexperience.com/pos — November 25, 2020
good article so thank u for sharing with us
KohlsFeedback Survey — November 13, 2021
Save money by taking Customer Feedback Surveys at https://www.thetechsurveys.com.
Reto — April 18, 2022
Thanks for the details article about survey. You can participate in various customer survey at https://erasurvey.org/
tellwag com — July 28, 2022
visit https://www.tellwag.com/ to take the Walgreens guest satisfaction survey
Seiraa — September 5, 2022
Walgreens pharmacy company is now taking the customers experience through an online customer satisfaction survey at WalgreensListens.Com Survey website. By using the customers survey data they will better their services and will give the best customer experience.
war den mu — June 12, 2023
Nice blog