Search results for survey

According to Nicole Arbout’s youtube video “Dear Fat People,” fat people deserve to be ridiculed and treated poorly. The comedian mocks obese people and accuses them of being lazy, smelly, self-destructive, and a burden to the health care system and those around them.  Fat people, she also suggests, cause heartache and embarrassment to their loved ones and are public nuisances to strangers by taking up too much space on airplanes and getting the closest spaces in shopping mall parking lots. Arbour even compares fat bodies to the Michelin Man and implores those who are overweight to put down the coke and fries, start exercising, and get healthy.

In case Arbour’s point was lost amid her six-minute diatribe, “Fat shaming is not a thing. Fat people made that up.”

But research proves otherwise.

Over a decade ago work supported by Yale University’s Rudd Center for Food Policy and Obesity showed that fifteen percent of respondents would be willing to give up 10 years of their lives to avoid being fat. Nearly one-half of respondents would give up one year of their lives to do the same. About eight percent of these same survey respondents also indicated they would rather have a learning-disabled child than an obese child (source). Such findings illuminate clearly the stigma associated with being obese as well as the fear that people have of being targets of the prejudice and discrimination stemming from it.

These fears are well founded. Obese people continue to face prejudice and discrimination in a wide variety of ways, according to recent research from the Rudd Report. In the educational system, overweight and obese children report being teased and bullied by peers and teachers alike.

Obesity also has consequences in the workplace. Those who are obese can expect to earn lower wages and be promoted less often than their thinner coworkers, despite positive work evaluations.

5

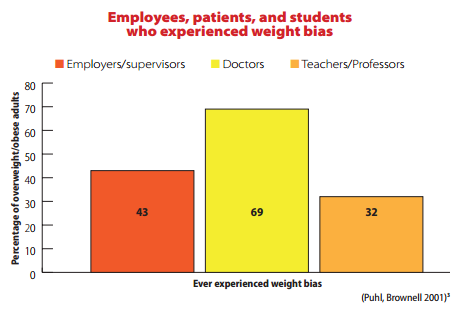
Overweight and obese people should not expect to find respite from the health care system either. Survey data consistently show that a significant number of doctors and nurses think obese patients are lazy, awkward, and noncompliant. Many of these same medical professionals also report being repulsed by such patients, attitudes which certainly affect the type and quality of care that obese patients receive.

To be sure, obesity contributes to health conditions like heart disease, some forms of cancer, diabetes, among others. It can also lead to early death, conclusions that Arbour’s video also makes. But obese people do not deserve to be ridiculed or discriminated against.

While Arbour now claims that “Dear Fat People” and the humor in it is satire, she perpetuates longstanding beliefs about overweight and obese people, legitimates the unfair treatment that they face on a daily basis, and proves that, yes, fat shaming is a thing.

Jacqueline Clark, PhD is an associate professor of sociology and chair of the department at Ripon College. Her research focuses on inequalities, the sociology of health and illness, and the sociology of jobs, work, and organizations.

One of the major contributions of political scientist Benedict Anderson is the idea of an “imagined community”: a large group of people connected not through interaction, but by the idea that they are part of a meaningful group. In his book on the idea, he wrote:

It is imagined because the members of even the smallest nation will never know most of their fellow-members, meet them, or even hear of them, yet… it is imagined as a community, because, regardless of the actual inequality and exploitation that may prevail in each, the nation is always conceived as a deep, horizontal comradeship. I suppose the idea might apply as well to religions.

Last week was a special week for American Catholics. The Pope’s visit to the U.S. was energizing, arguably intensifying the connection Catholics feel to their religion and, by extension, each other. But what, really, do Catholics have in common?

I don’t know, but agreement on what is sinful is not one of them. A Pew Research Center survey of Catholics reveals, instead, quite a lot of disagreement. Some Catholics don’t believe in the concept of sin at all and the remaining don’t always agree on what is sinful.

4

According to the results of the survey, for example, there is considerable disagreement as to whether abortion, homosexual behavior, hoarding wealth, divorce, unmarried cohabitation, and harming the environment are sinful. Moreover, plenty do not ascribe to some aspects of Catholic doctrine: only 17% of Catholics, for example, think that using contraception is sinful.

So, what does it mean to be Catholic?

Anderson might argue that they are simply an imagined community: a group of strangers with widely divergent views and life circumstances who feel the same despite all the reasons to feel different.

Lisa Wade, PhD is an Associate Professor at Tulane University. She is the author of American Hookup, a book about college sexual culture; a textbook about gender; and a forthcoming introductory text: Terrible Magnificent Sociology. You can follow her on Twitter and Instagram.

In a new blog post, Brad Wilcox and Nicholas Wolfinger ask, “are red or blue spouses happier?” Their answer — suspense — red.

Using the 2010-2014 General Social Survey, they start with this descriptive figure:

marital-quality-fig-1

Then they do adjustments, and show how their statistical controls explain the “Republican advantage in marital satisfaction.” And get this:

marital-quality-fig3

So, with all those controls, the “Republican advantage” remains.

That was enough for the sadly credulous David Leonhardt, editor of the New York Times Upshot site, to conclude:

Liberal attitudes toward gender equality, sexual orientation and education all seem to foster stronger, more stable family lives. But Mr. Wilcox’s recent writings strike me as significant because they’re a reminder that conservatism also has values and cultural attitudes — about the importance of marriage and family life — that seem to improve the environment in which children grow up.

Quite a conclusion to draw from a 3% net difference in a question on marital happiness — not exactly the best measure of “the environment in which children grow up.” But more importantly, I think it’s empirically wrong anyway.

Wilcox and Wolfinger left out all the details of their analysis, but it was easy to replicate it pretty closely. As a left-versus-right story it just doesn’t hold up. The GSS allows people to specify eight party identifications (including “other party”), not just three (Democrat, Republican, Independent). Wilcox and Wolfinger code those as “Independent, near Democrat/Republican” as identifying with the parties, but they don’t show the whole pattern:

marital-happiness-partyid.xlsx

The upward slope toward “strong Democrats” undermines the left-right story. Still, the figure skews right. When I apply the statistical controls, however, the differences are muted:

marital-happiness-partyid.xlsx

Now the “strong Democrats” appear happier than all but the “strong Republicans.” And not even the “strong Republicans” are significantly more likely to say they’re “very happy” in marriage than the “strong Democrats.” Here’s the relevant part of the table:

marital-happiness-partyid-coefs

Lots of ways you could interpret this. But I’m pretty sure the Wilcox and Wolfinger conclusion is not supported: “married Republicans are more likely than married Democrats to say they are in very happy marriages.” And the Leonhardt conclusion is just ridiculous (insofar as it’s based on these data).

Note: I did this really quickly. If I made a mistake, feel free to correct me. But I’m still calling this a “research brief” and a “report.”  More methodological details here.

Philip N. Cohen is a professor of sociology at the University of Maryland, College Park. He writes the blog Family Inequality, where this post originally appeared, and is the author of The Family: Diversity, Inequality, and Social Change. You can follow him on Twitter or Facebook.

The margin of error is getting more attention than usual in the news. That’s not saying much since it’s usually a tiny footnote, like those rapidly muttered disclaimers in TV ads (“Offer not good mumble mumble more than four hours mumble mumble and Canada”). Recent headlines proclaim, “Trump leads Bush…” A paragraph or two in, the story will report that in the recent poll Trump got 18% and Bush 15%.  That difference is well within the margin of error, but you have to listen closely to hear that. Most people usually don’t want to know about uncertainty and ambiguity.

What’s bringing uncertainty out of the closest now is the upcoming Republican presidential debate. The Fox-CNN-GOP axis has decided to split the field of presidential candidates in two based on their showing in the polls. The top ten will be in the main event. All other candidates – currently Jindal, Santorum, Fiorina, et al. – will be relegated to the children’s table, i.e., a second debate a month later and at the very unprime hour of 5 p.m.

But is Rick Perry’s 4% in a recent poll (419 likely GOP voters) really in a different class than Bobby Jindal’s 25? The margin of error that CNN announced in that survey was a confidence interval of  +/- 5.  Here’s the box score.

2
Jindal might argue that, with a margin of error of 5 points, his 2% might actually be as high as 7%, which would put him in the top tier.He might argue that, but he shouldn’t.  Downplaying the margin of error makes a poll result seem more precise than it really is, but using that one-interval-fits-all number of five points understates the precision. That’s because the margin of error depends on the percent that a candidate gets. The confidence interval is larger for proportions near 50%, smaller for proportions at the extreme.

Just in case you haven’t taken the basic statistics course, here is the formula.

4
The   (pronounced “pee hat”) is the proportion of the sample who preferred each candidate. For the candidate who polled 50%, the numerator of the fraction under the square root sign will be 0.5 (1-0.5) = .25.  That’s much larger than the numerator for the 2% candidate:  0.02 (1-0.02) = .0196.*Multiplying by the 1.96, the 50% candidate’s margin of error with a sample of 419 is +/- 4.8. That’s the figure that CNN reported. But plug in Jindal’s 2%, and the result is much less: +/- 1.3.  So, there’s a less than one in twenty chance that Jindal’s true proportion of support is more than 3.3%.

Polls usually report their margin of error based on the 50% maximum. The media reporting the results then use the one-margin-fits-all assumption – even NPR. Here is their story from May 29 with the headline “The Math Problem Behind Ranking The Top 10 GOP Candidates”:

There’s a big problem with winnowing down the field this way: the lowest-rated people included in the debate might not deserve to be there.

The latest GOP presidential poll, from Quinnipiac, shows just how messy polling can be in a field this big. We’ve put together a chart showing how the candidates stack up against each other among Republican and Republican-leaning voters — and how much their margins of error overlap.

14


The NPR writer, Danielle Kurtzleben, does mention that “margins might be a little smaller at the low end of the spectrum,” but she creates a graph that ignores that reality.The misinterpretation of presidential polls is nothing new.  But this time that ignorance will determine whether a candidate plays to a larger or smaller TV audience.

—————————–

* There are slightly different formulas for calculating the margin of error for very low percentages.  The Agresti-Coull formula gives a confidence interval even if there are zero Yes responses. (HT: Andrew Gelman)

Originally posted at Montclair SocioBlog.

Jay Livingston is the chair of the Sociology Department at Montclair State University. You can follow him at Montclair SocioBlog or on Twitter.

A new survey of 557 female scientists found widespread experiences of discrimination and alienation in the workforce that varied in interesting ways by race.7

While all types of women reported experiencing these forms of discrimination in large numbers — and 100% of a sub-sample of 60 interviewed for the study reported at least one — the race differences are interesting:

  • Black women were especially likely to need to prove and re-prove competence.
  • Asian and white women, especially, received pressure to withdraw from the workplace after having children.
  • Asian women were most likely to be pushed to perform a stereotypically feminine role in the office, followed by white and then Latina women. Black women rarely reported this.
  • Latina and white women were most likely to feel supported by other women in the workforce; Black women the least.
  • And almost half of Black and Latina women had been mistaken for janitors or administrative assistants, compared to a third of white women and a quarter of Asian women.

The study, by law professor Joan Williams and two colleagues, can be found here.

Lisa Wade, PhD is an Associate Professor at Tulane University. She is the author of American Hookup, a book about college sexual culture; a textbook about gender; and a forthcoming introductory text: Terrible Magnificent Sociology. You can follow her on Twitter and Instagram.

One of the important conversations that has began in the wake of Dylann Roof’s racist murder in South Carolina has to do with racism among members of the Millennial generation. We’ve placed a lot of faith in this generation to pull us out of our racist path, but Roof’s actions may help remind us that racism will not go away simply by the passing of time.

In fact, data from the General Social Survey — one of the most trusted social science data sets — suggests that Millennials are failing to make dramatic strides toward a non-racist utopia. Scott Clement, at the Washington Post, shows us the data. Attitudes among white millennials (in green below) are statistically identical to whites in Generation X (yellow) and hardly different from Baby Boomers on most measures (orange). Whites are about as likely as Generation X:

  • to think that blacks are lazier or less hardworking than whites
  • to think that blacks have less motivation than whites to do well
  • to oppose living in a neighborhood that is 50% or more black
  • to object if a relative marries a black person

And they’re slightly more likely than white members of Generation X to think that blacks are less intelligent than whites. So much for a Millennial rescue from racism.

4 5 6 7 8

All in all, white millennial attitudes are much more similar to those of older whites than they are to those of their peers of color.

***

At PBS, Mychal Denzel Smith argues that we are reaping the colorblindness lessons that we’ve sowed. Millennials today may think of themselves as “post-racial,” but they’ve learned none of the skills that would allow them to get there. Smith writes:

Millennials are fluent in colorblindness and diversity, while remaining illiterate in the language of anti-racism.

They know how to claim that they’re not racist, but they don’t know how to recognize when they are and they’re clueless as to how to actually change our society for the better.

So, thanks to the colorblindness discourse, white Millennials are quick to see racism as race-neutral. In one study, for example, 58% of white millennials said they thought that “reverse racism” was as big a problem as racism.

Smith summarizes the problem:

For Millennials, racism is a relic of the past, but what vestiges may still exist are only obstacles if the people affected decide they are. Everyone is equal, they’ve been taught, and therefore everyone has equal opportunity for success. This is the deficiency found in the language of diversity. … Armed with this impotent analysis, Millennials perpetuate false equivalencies, such as affirmative action as a form of discrimination on par with with Jim Crow segregation. And they can do so while not believing themselves racist or supportive of racism.

Lisa Wade, PhD is an Associate Professor at Tulane University. She is the author of American Hookup, a book about college sexual culture; a textbook about gender; and a forthcoming introductory text: Terrible Magnificent Sociology. You can follow her on Twitter and Instagram.

At the end of this month, the Supreme Court will hear arguments as to whether the Constitution requires states to allow same-sex marriages and to recognize same-sex marriages allowed in other states. In the arguments heard in the lower courts and the record-setting number of amici filed for this case, debate has often veered from whether same-sex couples should be able to marry and waded into the question of how they parent children. Social science research has been front and center in this debate, with a variety of studies examining whether families with two parents of a different sex provide better environments for raising children than two parents of the same sex.

No differences? In general, these studies have examined differences in children’s developmental outcomes to make inferences about differences in what is happening in the home, conflating how children do with the ways that people parent in same-sex and different-sex couples. The “no differences” conclusion refers to the fact that few studies have revealed significant differences in these outcomes between children raised by different-sex parents and same-sex parents. This conclusion about parenting based on data on children, however, may be biased in both directions. For example, same-sex couples are more likely to adopt “hard-to-place” children from the foster care system. They are also more likely to have children who have experienced family instability because they transitioned into new family settings after being in families headed by ‘straight’ couples. Both of these factors are known to affect children’s wellbeing, but they are not as strongly tied to parenting.

New study clarifies. In our new study in the June issue of Demography, we directly address the arguments being made about differences in parenting in two-parent families by examining parents’ actual behaviors. Using the nationally representative American Time Use Survey, we examine how much time parents in same-sex and different-sex couples spend in child-focused activities during a 24-hour period, controlling for a wide range of factors that are also associated with parenting, such as income, education, time spent at work, and the number and age of children in the family. By ‘child-focused’ time, we mean time spent engaged with children in activities that support their physical and cognitive development, like reading to them, playing with them, or helping them with their homework.

Supporting a no differences conclusion, our study finds that women and men in same-sex relationships and women in different-sex relationships do not differ in the amount of time they spend in child-focused activities (about 100 minutes a day). We did find one difference, however, as men in different-sex relationships spend only half as much child-focused time as the other three types of parents. Averaging across mothers and fathers, we determined that children with same-sex parents received an hour more of child-focused parent time a day (3.5 hours) than children in different-sex families (2.5 hours).

A key implication of our study is that the focus on whether same-sex parents provide depreciably different family contexts for healthy child development is misplaced. If anything, the results show that same-sex couples are more likely to invest time in the types of parenting behaviors that support child development. In line with a recent study that has continued to highlight that poverty — more so than family structure — is the greatest detriment to parenting practices, it’s hard not to see how delegitimizing same-sex families in ways that create both social and economic costs for them, pose a greater source of disadvantage for children.

Cross-posted at Families as They Really Are and Pacific Standard.

Kate Prickett is a PhD candidate in the Department of Sociology and the Population Research Center at the University of Texas at Austin; Alexa Martin-Storey is a developmental psychologist and Assistant Professor at the Université de Sherbrooke, in Sherbrooke, Quebec. You can find their new study (with Robert Crosnoe) here.

Chris Christie’s net worth (at least $4 million) is 50 times that of the average American. His household income of $700,000 (his wife works in the financial sector) is 13 times the national median.  But he doesn’t think he’s rich.

I don’t consider myself a wealthy man. . . . and I don’t think most people think of me that way.

That’s what he told the Manchester Union-Leader on Monday when he was in New Hampshire running for president.

Of course, being out of touch with reality doesn’t automatically disqualify a politician from the Republican nomination, even at the presidential level, though misreading the perceptions of “most people” may be a liability.

But I think I know what Christie meant. He uses the term “wealth,” but what he probably has in mind is class.  He says, “Listen, wealth is defined in a whole bunch of different ways . . . ”  No, Chris. Wealth is measured one way – dollars. It’s social class that is defined in a whole bunch of different ways.

One of those ways, is self-perception.

“If you were asked to use one of four names for your social class, which would you say you belong in: the lower class, the working class, the middle class, or the upper class?”

That question has been part of the General Social Survey since the start in 1972. It’s called “subjective social class.” It stands apart from any objective measures like income or education. If an impoverished person who never got beyond fifth grade says that he’s upper class, that’s what he is, at least on this variable. But he probably wouldn’t say that he’s upper class.

Neither would Chris Christie. But why not?

My guess is that he thinks of himself as “upper middle class,” and since that’s not one of the GSS choices, Christie would say “middle class.”  (Or he’d tell the GSS interviewer where he could stick his lousy survey. The governor prides himself on his blunt and insulting responses to ordinary people who disagree with him.)

1c

This  self-perception as middle class rather than upper can result from “relative deprivation,” a term suggesting that how you think about yourself depends on who are comparing yourself with.* So while most people would not see the governor as “deprived,” Christie himself travels in grander circles. As he says, “My wife and I . . . are not wealthy by current standards.” The questions is “Which standards?”  If the standards are those of the people whose private jets he flies on, the people he talks with in his pursuit of big campaign donations – the Koch brothers, Ken Langone (founder of Home Depot), Sheldon Adelson, Jerry Jones, hedge fund billionaires, et al. – if those are the people he had in mind when he said, “We don’t have nearly that much money,” he’s right. He’s closer in wealth to you and me and middle America than he is to them.

I also suspect that Christie is thinking of social class not so much as a matter of money as of values and lifestyle – one of  that bunch of ways to define class. To be middle class is to be one of those solid Americans – the people who, in Bill Clinton’s phrase, go to work and pay the bills and raise the kids. Christie can see himself as one of those people. Here’s a fuller version of the quote I excerpted above.

Listen, wealth is defined in a whole bunch of different ways and in the end Mary Pat and I have worked really hard, we have done well over the course of our lives, but, you know, we have four children to raise and a lot of things to do.

He and his wife go to work; if they didn’t, their income would drop considerably. They raise the kids, probably in conventional ways rather than sloughing that job off on nannies and boarding schools as upper-class parents might do. And they pay the bills. Maybe they even feel a slight pinch from those bills. The $100,000 they’re shelling out for two kids in private universities may be a quarter of their disposable income, maybe more. They are living their lives by the standards of “middle-class morality.” Their tastes too are probably in line with those of mainstream America. As with income, the difference between the Christies and the average American is one of degree rather than kind. They prefer the same things; they just have a pricier version. Seats at a football game, albiet in the skyboxes, but still drinking a Coors Light. It’s hard to picture the governor demanding a glass of Haut Brion after a day of skiing on the slopes at Gstaad, chatting with (God forbid) Euorpeans.

Most sociological definitions of social class do not include values and lifestyle, relying on more easily measured variables like income, education, and occupation. But for many people, including the governor, morality and consumer preference may weigh heavily in perceptions and self-perceptions of social class.

Jay Livingston is the chair of the Sociology Department at Montclair State University. You can follow him at Montclair SocioBlog or on Twitter.