Search results for survey

Many of us know the Officer Friendly story. He epitomizes liberal police virtues. He seeks the public’s respect and willing cooperation to follow the law, and he preserves their favor with lawful enforcement.

Norman Rockwell’s The Runaway, 1958

The Officer Friendly story also inspired contemporary reforms that seek and preserve public favor, including what most people know as Community Policing. Norman Rockwell’s iconic painting is an idealized depiction of this narrative. Officer Friendly sits in full uniform. His blue shirt contrasts sharply with the black boots, gun, and small ticket book that blend together below the lunch counter. He is a paternalistic guardian. The officer’s eyes are fixed on the boy next to him. The lunch counter operator surveying the scene seems to smirk. All of them do, in fact. And all of them are White. The original was painted from the White perspective and highlighted the harmonious relationship between the officer and the boy. But for some it may be easy to imagine a different depiction: a hostile relationship between a boy of color and an officer in the 1950s and a friendly one between a White boy and an officer now.
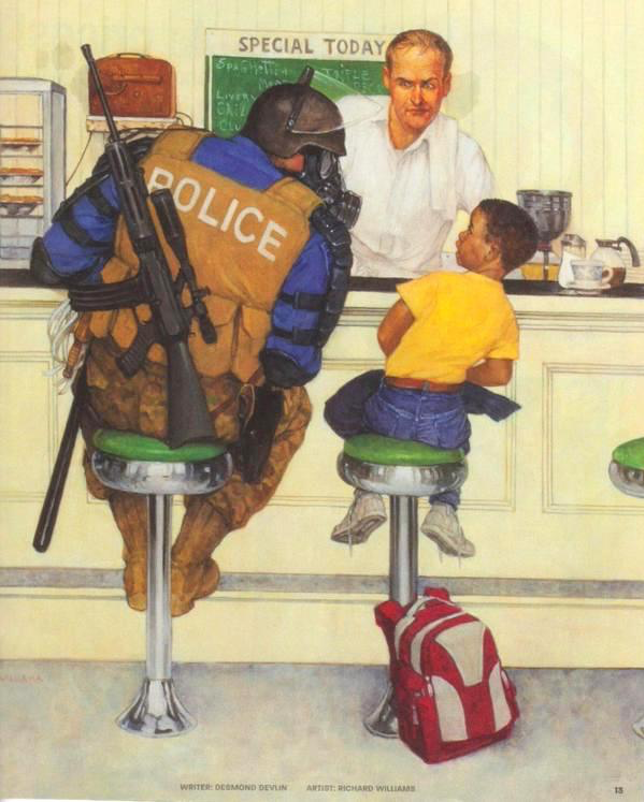
Desmond Devlin (Writer) and Richard Williams’s (Artist) The Militarization of the Police Department, a painting parody of Rockwell’s The Runaway, 2014

The parody of Rockwell’s painting offers us a visceral depiction of contemporary urban policing. Both pictures depict different historical eras and demonstrate how police have changed. Officer Unfriendly is anonymous, of unknown race, and presumably male. He is prepared for battle, armed with several weapons that extend beyond his imposing frame. Officer Unfriendly is outfitted in tactical military gear with “POLICE” stamped across his back. The images also differ in their depictions of the boy’s race and his relationship to the officer. Officer Unfriendly appears more punitive than paternalistic. He looms over the Black boy sitting on the adjacent stool and peers at him through a tear gas mask. The boy and White lunch counter operator back away in fright. All of the tenderness in the original have given way to hostility in this parody.

Inspired by the critical race tradition, my new project “Officer Friendly’s Adventures in Wonderland: A Counter-Story of Race Riots, Police Reform, and Liberalism” employs composite counter-storytelling to narrate the experiences of young men of color in their explosive encounters with police. Counter-stories force dominant groups to see the world through the “Other’s” (non-White person’s) eyes, thereby challenging their preconceptions. I document the evolution of police-community relations in the last eighty years, and I reflect on the interrupted career of our protagonist, Officer Friendly. He worked with the Los Angeles Police Department (LAPD) for several stints primarily between the 1940s and 1990s.

My story focuses on Los Angeles, a city renowned for its police force and riot history. This story is richly informed by ethnographic field data and is further supplemented with archival and secondary historical data. It complicates the nature of so-called race riots, highlights how Officer Friendly was repeatedly evoked in the wake of these incidents, and reveals the pressures on LAPD officials to favor increasingly unfriendly police tactics. More broadly, the story of Officer Friendly’s embattled career raises serious questions about how to achieve racial justice. This work builds on my recently published coauthored book, The Limits of Community Policing, and can shape future critical race scholarship and historical and contemporary studies of police-community relations.
Daniel Gascón is an assistant professor of sociology at the University of Massachusetts Boston. For more on his latest work, follow him on Twitter.

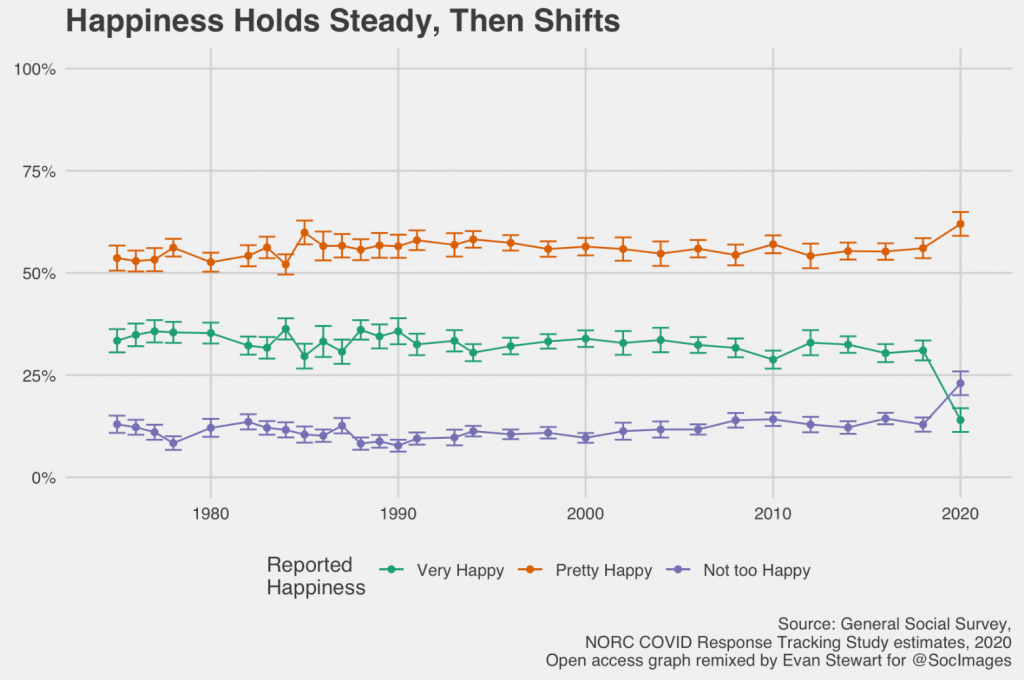
One important lesson from political science and sociology is that public opinion often holds steady. This is because it is difficult to get individual people to change their minds. Instead, people tend to keep consistent views as “settled dispositions” over time, and mass opinion changes slowly as new people age into taking surveys and older people age out.

Sometimes public opinion does change quickly, though, and these rapid changes are worth our attention precisely because they are rare. For example, one of the most notable recent changes is the swing toward majority support for same-sex marriage in the United States in just the last decade.

That’s why a new finding is so interesting and so troubling: NORC is reporting a pretty big swing in self-reported happiness since the pandemic broke out using a new 2020 survey conducted in late May. Compared to earlier trends from the General Social Survey, fewer people are reporting they are “very happy,” optimism about the future is down, and feelings of isolation and loneliness are up. The Associated Press has dynamic charts here, and I made an open-access, creative commons version of one visualization using GSS data and NORC’s estimates:

As with any survey trend, we will need more data to get the true shape of the change and see whether it will persist over time. Despite this, one important point here is the consistency before the new 2020 data. Think about all the times aggregated happiness reports didn’t really change: we don’t see major shifts around September 11th, 2001, and there are only small changes around the Gulf War in 1990 or the 2008 financial crisis.

There is something reassuring about such a dramatic drop now, given this past resilience. If you’re feeling bad, you’re not alone. We have to remember that emotions are social. People have a remarkable ability to persist through all kinds of trying times, but that is often because they can connect with others for support. The unprecedented isolation of physical distancing and quarantine has a unique impact on our social relationships and, in turn, it could have a dramatic impact on our collective wellbeing. The first step to fixing this problem is facing it honestly.

Inspired by demographic facts you should know cold, “What’s Trending?” is a post series at Sociological Images featuring quick looks at what’s up, what’s down, and what sociologists have to say about it.

Evan Stewart is an assistant professor of sociology at University of Massachusetts Boston. You can follow his work at his website, on Twitter, or on BlueSky.

Who’s afraid of a global pandemic? We all are, at the
moment. But like so many other forms of fear, concern about medical issues is
much more acute for people in precarious and vulnerable social positions. The
privileged—particularly those who are white and upper class—can more afford not
to be preoccupied with health and medical concerns, including pandemics.

In our new book Fear Itself, we found consistent support for updating our classic theories about vulnerability. Classic theories often understand vulnerability in physical terms. But risk and vulnerability are also social, rather than primarily physical, and we found consistent evidence that members of disadvantaged status groups—particularly women, racial and ethnic minorities, and those with lower levels of social class—had higher levels of fear across many domains.

Using pooled data from six waves (2014–2019) of Chapman Survey of American Fears (CSAF), we examined the sociological patterns of fears about disease and health. We looked at fear about four specific issues: global pandemics, fears of becoming seriously ill, and fears about people you love becoming seriously ill or dying.     

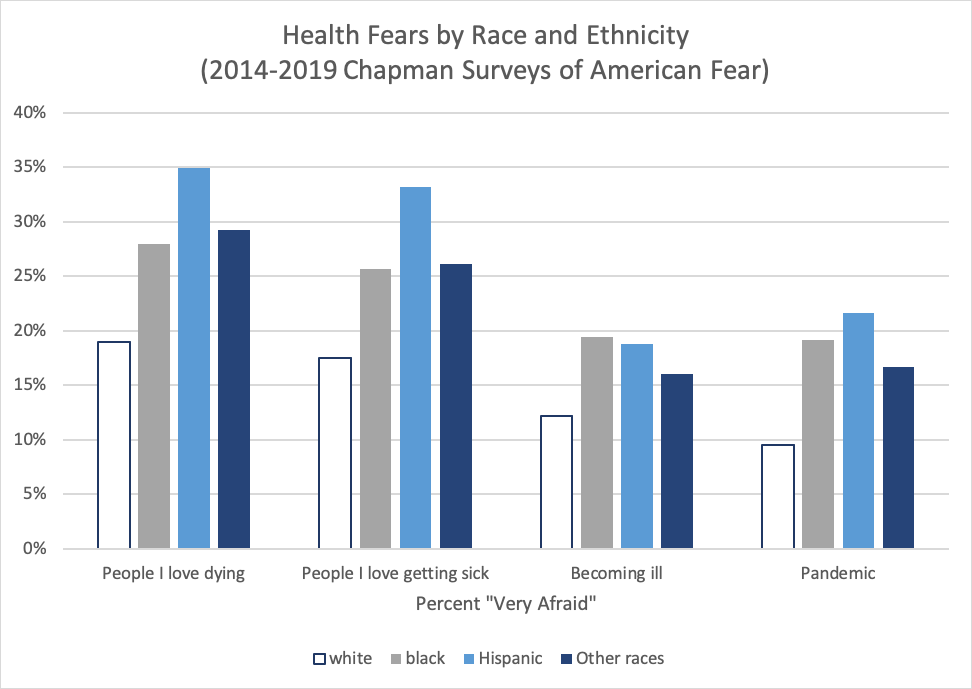
The racial and ethnic disparities across these four outcomes
are striking, with white Americans being significantly less likely to report
being “very afraid” of pandemics and medical issues involving themselves or
their families. Hispanic Americans reported the greatest concern about all four
issues, likely a reflection of lower rates of health care insurance and access
among Latino/a communities and individuals.

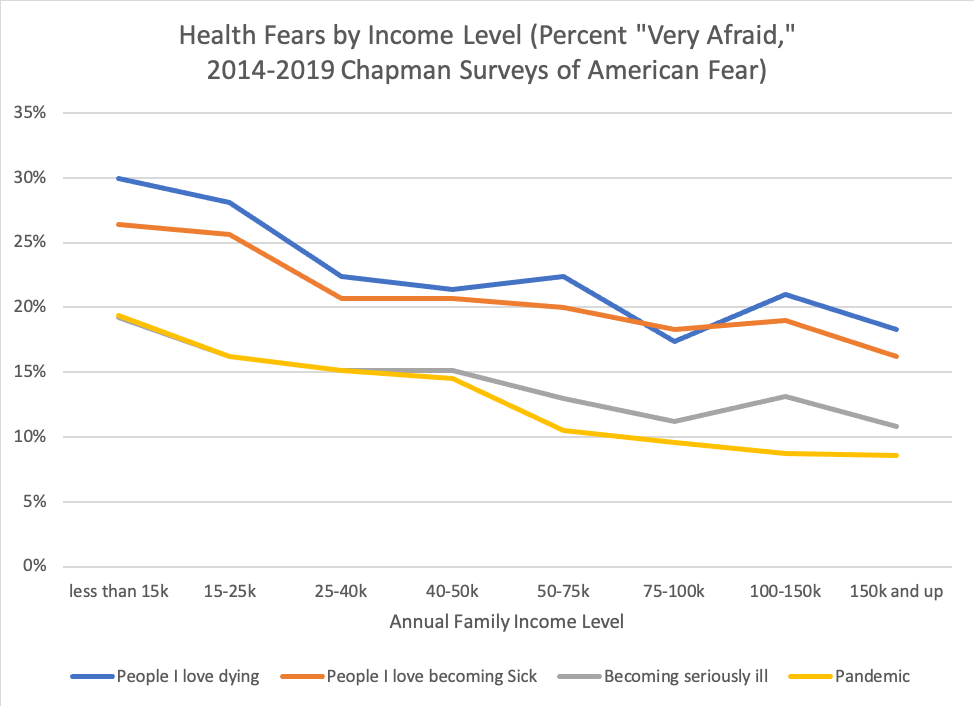
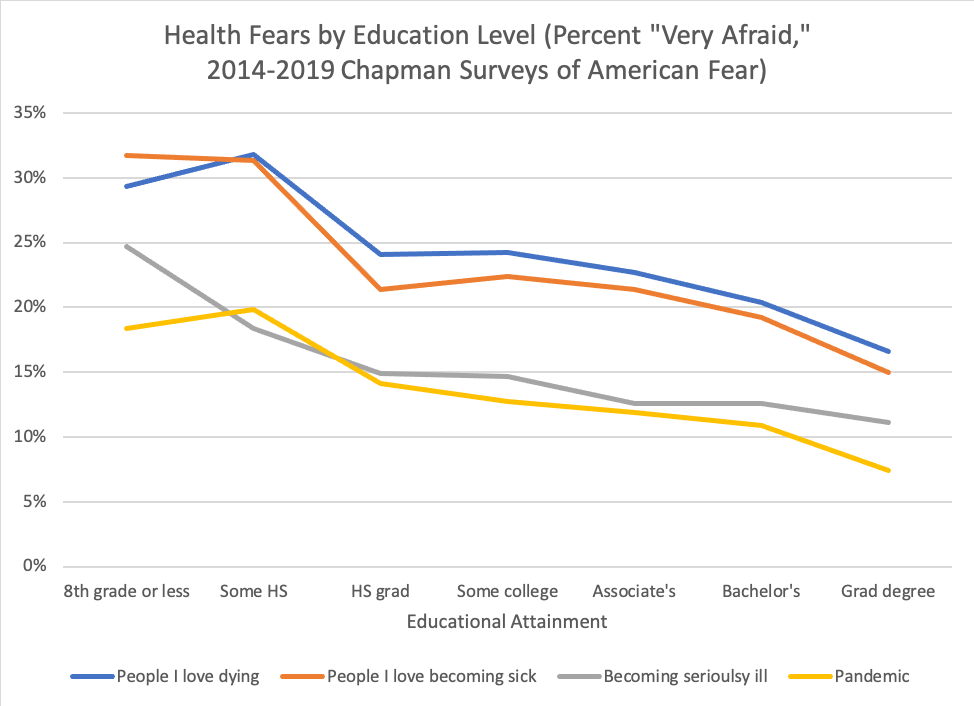
Likewise, we find clear disparities in fears about health and pandemics across different levels of education and family income. Again, the mechanisms are clear, with vast disparities in health care access in the United States, as well as the well-known social determinants of disease both playing a role.

While these patterns are not necessarily surprising, they are nonetheless disconcerting, for a number of reasons. First, in terms of the epidemiology of the Coronavirus pandemic, it is the disempowered who will disproportionately bear the brunt of the negative health effects, and who will be least equipped with the resources to adequately respond if and when they get sick. Second, when preventative public health measures such as quarantines are put in place, it is people in the working and lower classes who can least afford to take time off of work or keep their children home from school in order to comply with public health procedures.

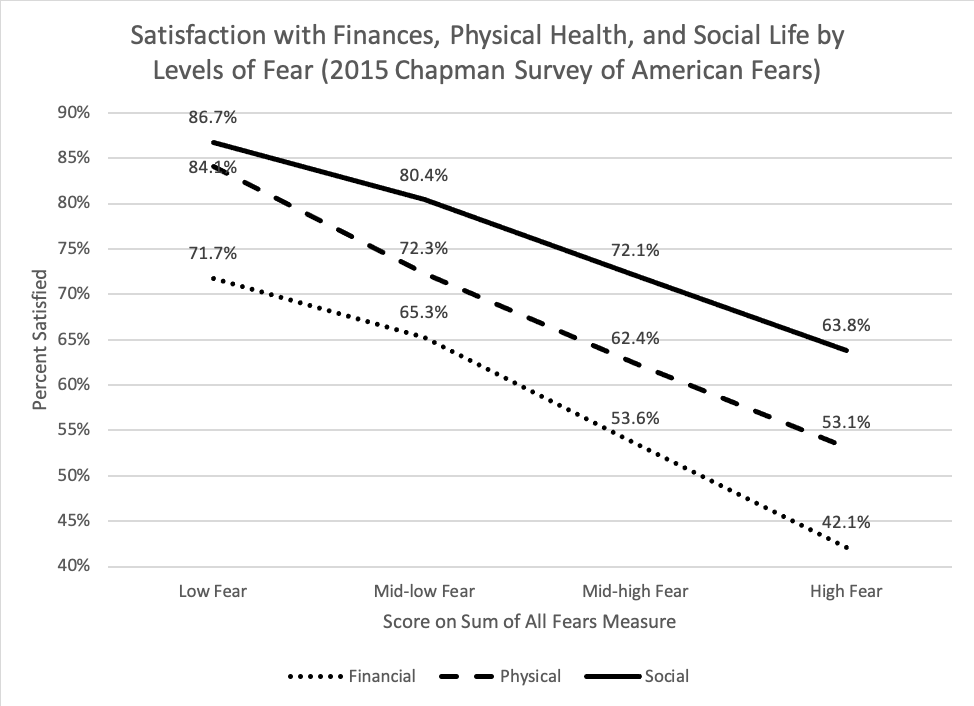
Not only does fear disproportionately prey upon people in less powerful social positions, it also exacerbates and deepens inequality. Higher levels of fear and anxiety are strongly and significantly related to harmful health outcomes, even after accounting for the social inequalities that structure who is afraid in the first place. In Fear Itself we created an omnibus fear metric we called the “Sum of All Fears” that combined levels of fear across a wide range of domains, including but not limited to health, crime, environmental degradation, and natural disasters. Scores on this global, summary fear metric once again produced strong support for social vulnerability theory; but levels of fear were also strongly connected to steep declines in quality of life across a range of domains, including social, personal, and financial well-being.

Taken together, fear is both a reflection of and a source of social inequality. This is true for the current global Coronavirus pandemic and the accompanying concerns, but it will also be the case long after the pandemic has passed. Our hope is that sociologists, social psychologists, and public health officials begin to consider how fear factors into and deepens social inequality.

Joseph O. Baker is Associate Professor in the Department of Sociology and Anthropology at East Tennessee State University and a senior research associate for the Association of Religion Data Archives.

Ann Gordon is Associate Professor of Political Science and Director of the Ludie and David C. Henley Social Science Research Laboratory, Chapman University.

L. Edward Day is Associate Professor and Chair of the Sociology Department at Chapman University.

Christopher D. Bader is Professor of Sociology at Chapman University and affiliated with the Institute for Religion, Economics and Culture (IRES). He is Associate Director of the Association of Religion Data Archives (www.theARDA.com) and principal investigator on the Chapman University Survey of American Fears.

Sociologists
studying emotion have opened up the inner, private feelings of anger, fear,
shame, and love to reveal the far-reaching effects of social forces on our most
personal experiences. This subfield has given us new words to make sense of shared
experiences: emotional labor in our professional lives, collective
effervescence at sporting events and concerts, emotional capital as a resource
linked to gender, race, and class, and the relevance of power in shaping
positive and negative emotions.

Despite
these advances, scholars studying emotion still struggle to capture emotion
directly. In the lab, we can elicit certain emotions, but by removing context,
we remove much of what shapes real-life experiences. In surveys and interviews,
we can ask about emotions retrospectively, but rarely in the moment and in
situ.

One
way to try to capture emotions as they unfold in all of their messy glory is
through audio diaries (Theodosius 2008). Our team set out to use audio
diaries as a way to understand the emotions of hospital nurses—workers on the
front lines of healthcare. We asked nurses to make a minimum of one recording
after each of 6 consecutive shifts. Some made short 10-minute recordings. Some
talked for hours in the midst of beeping hospital machines and in break rooms,
while walking to their cars, driving home, and as they unplugged after a long
day. With the recorders out in the world, we couldn’t control what they
discussed. We couldn’t follow-up with probing questions or ask them to move to
a quieter location to minimize background noise.

But what this lack of control gave us was a trove of emotions and reflections, experienced and processed while recording. One fruitful way to try to distill these data, we found, was through visuals. We created wavelength visualizations in order to augment our interpretation of diary transcripts. Pairing the two reintroduces some of the ‘texture’ of spoken word often lost in the transcription process (Smart 2009:296). The following is from our new article in the journal, Qualitative Research (Cottingham and Erickson Forthcoming).

In this first segment, Tamara (all participant names are pseudonyms) describes a memorable situation in which a patient’s visitor assumed that Tamara was a lower-level nursing aid rather than a registered nurse (the full event is discussed in greater detail in Cottingham, Johnson, and Erickson 2018). This caused her to feel “ticked” (angry), which is the word she uses after a quick, high-pitched laugh that peaks the wavelength just after the 30-s mark (Figure 1). The wavelength peak just after the 1:15 mark is as she says the word ‘why’ with notable agitation in ‘I’m not sure why. Maybe cuz I’m Black. I don’t know.’

Figure 1. Tamara’s “Ticked” Segment (shift 2, part 1)

We can compare Figure 1 that visualizes Tamara’s feelings of
anger with the visualization of emotion in Figure 2. “Draining” is the
description Tamara gives at the beginning of this second segment. The peak just
after the 15-second mark is from a breathy laugh as she describes her sister “who
has MS is sitting on the bedside commode” when she gets home from work. After
the 45-second mark, she has a similar breathy laugh but in conjunction with the
word ‘compassionate’ as she says ‘I’m trying to be as empathetic and
compassionate as I want to be, but I know I’m really not. So I feel kinda
crappy, guilty maybe about that.’ Just before the 1:30 mark she draws out the
words ‘draining’ and ‘frustrating’ before finishing: ‘because you leave it and
you come home to it…you know…yeah.’ We can see that the segment ends with
longer pauses, muted remarks, and sighs, suggesting low energy and representing
the drained feelings she expresses, particularly in comparison to the lively
energy seen in the first segment when she discusses feeling angry.

Figure 2. Tamara’s “Draining” Segment (shift 2, part 2)

A second example comes from Leah, recorded while driving to work. Here she is angry (“pissed off”) because she has to work on a day that she was not originally scheduled to work. This segment is visualized in the waveform shown in Figure 3.

Figure 3. Leah’s ‘Righteous Indignation’ Segment (shift 2, part 1)
Figure 4. Leah’s ‘I Don’t Want to Stay’ Segment (shift 2, part 3)

In contrast to her discussion of being pissed off and working to ‘retain enough righteous indignation’ to confront her boss later (in figure 3), we see a different wavelength visualization in her second segment (figure 4). In that segment, she describes her lack of enthusiasm for continuing the shift. She reflects on this lack of desire (‘I don’t want to stay’) by stepping outside her own feelings and contrasting them with the dire circumstances of her young patient. This reflexivity leads her to conclude that she has reached the limits of her ability to be compassionate.

To
be sure, waveform visualizations are only meaningful in tandem with what our nurses say. And they do not
provide definitive proof of certain emotions over others. They can’t fully
identify the sighs, deep inhales, uses of sarcasm, or other subtle features of
spoken diary entries. They do, however, offer some insight into how speed,
pitch, and pauses correspond to different emotional expressions and, arguably,
levels of emotional energy (Collins 2004) that vary across time and interactions.

While
there is little that can serve as a substitute for hearing the recordings
directly, the need to protect participants’ confidentiality compels us to turn
to other means to convey the nuances of these verbalizations. Visualization of
wavelengths, in combination with transcripts, can lend themselves to further
qualitative interpretation of these subtleties, conveying the dynamics of a
segment to others who do not have direct access to the recordings themselves.

Check
out the full, open-access article on this topic here and more on the experiences of nurses
here.

Marci Cottingham is assistant professor of sociology at the University of Amsterdam. She researches emotion and inequality broadly and their connection to healthcare and biomedical risk. She is a 2019-2020 visiting fellow at the HWK Institute for Advanced Study. More on her research can be found here: www.uva.nl/profile/m.d.cottingham

References:

Collins, Randall.
2004. Interaction Ritual Chains. Princeton, New Jersey: Princeton
University Press.

Cottingham,
Marci D. and Rebecca J. Erickson. Forthcoming. “Capturing Emotion with Audio
Diaries.” Qualitative Research. https://doi.org/10.1177/1468794119885037

Cottingham,
Marci D., Austin H. Johnson, and Rebecca J. Erickson. 2018. “‘I Can Never Be
Too Comfortable’: Race, Gender, and Emotion at the Hospital Bedside.” Qualitative
Health Research
28(1):145–158. https://doi.org/10.1177/1049732317737980

Smart,
Carol. 2009. “Shifting Horizons: Reflections on Qualitative Methods.” Feminist
Theory
10(3):295–308.

Theodosius,
Catherine. 2008. Emotional Labour in Health Care: The Unmanaged Heart of
Nursing
. NY: Routledge.
[

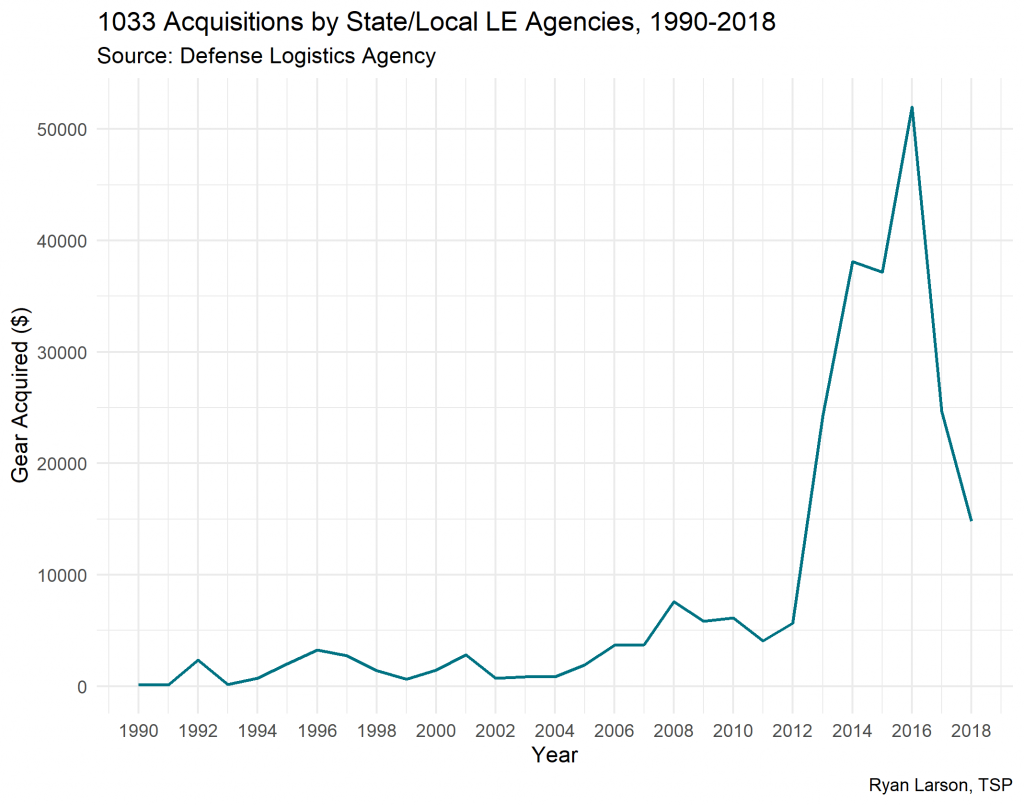
Modern policing is often characterized by quasi-militaristic tendencies, from “wars” on drugs and crime to its use armored vehicles and automatic weapons. The Department of Defense 1033 Program, which provides military equipment slated for storage to law enforcement agencies, is a popular way that police and sheriff’s departments acquire military gear. According to data from the Defense Logistics Agency, acquisitions of military equipment by state and local law enforcement sharply rose to a peak in 2016, and then have declined in recent years. But what explains participation in the DOD’s program? Which police departments acquire the most military equipment?

In a recent study published in Criminology, David Ramey and Trent Steidley investigate whether law enforcement agencies participated in the program and how much gear they acquired using 1033 program participation and U.S. Census and American Community Survey data. They find that participation in the 1033 — but not the value of gear acquired — is greater in areas of higher violent arrests. They also find that, after controlling for crime rates and other factors, higher local Black and Hispanic populations correlate with higher levels of participation and greater value acquired.

Las Vegas Metropolitan Police SWAT
Las Vegas Metropolitan Police SWAT, Photo by Tomás Del Coro, Flickr CC

However, these racial patterns are not linear. Agencies operating in areas with very small and very large minority populations have low probabilities of program participation, but agencies that serve a more diverse community are most likely to obtain military equipment through the 1033 program. For those that do participate, increases in minority populations correlated with higher dollar values of equipment acquired, with each subsequent increase garnering even more gear than the last (an exponential increase). In other words, program participation increases in response to racial demographics up to an extent, but once an agency decides to participate, the value of military equipment requested dramatically increases as minority populations increase.

Trends in police militarization highlight two patterns. Law enforcement agencies respond to increasing crime rates with police militarization, possibly in an attempt to deter further crime. In contrast, the racial effects found in this study follow  a “minority threat” model, as military acquisitions correspond to the presence of racial minority groups. This research illustrates how race, net of the crime rates in an area, can pattern not only where police operate, but how they operate.

Ryan Larson is a graduate student from the Department of Sociology, University of Minnesota – Twin Cities. He studies crime, punishment, and quantitative methodology. He is a member of the Graduate Editorial Board of The Society Pages.

Recent estimates indicate that roughly 45 million students in the United States have incurred student loans during college. Democratic candidates like Senators Elizabeth Warren and Bernie Sanders have proposed legislation to relieve or cancel  this debt burden. Sociologist Tressie McMillan Cottom’s congressional testimony on behalf of Warren’s student loan relief plan last April reveals the importance of sociological perspectives on the debt crisis. Sociologists have recently documented the conditions driving student loan debt and its impacts across race and gender. 

College debt is the new black.
Photo Credit: Mike Rastiello, Flickr CC

In recent decades, students have enrolled in universities at increasing rates due to the “education gospel,” where college credentials are touted as public goods and career necessities, encouraging students to seek credit. At the same time, student loan debt has rapidly increased, urging students to ask whether the risks of loan debt during early adulthood outweigh the reward of a college degree. Student loan risks include economic hardship, mental health problems, and delayed adult transitions such as starting a family.Individual debt has also led to disparate impacts among students of color, who are more likely to hail from low-income families. Recent evidence suggests that Black students are more likely to drop out of college due to debt and return home after incurring more debt than their white peers. Racial disparities in student loan debt continue into their mid-thirties and impact the white-Black racial wealth gap.

365.75
Photo Credit: Kirstie Warner, Flickr CC

Other work reveals gendered disparities in student debt. One survey found that while women were more likely to incur debt than their male peers, men with higher levels of student debt were more likely to drop out of college than women with similar amounts of debt. The authors suggest that women’s labor market opportunities — often more likely to require college degrees than men’s — may account for these differences. McMillan Cottom’s interviews with 109 students from for-profit colleges uncovers how Black, low-income women in particular bear the burden of student loans. For many of these women, the rewards of college credentials outweigh the risks of high student loan debt.

Amber Joy is a PhD candidate in the Department of Sociology at the University of Minnesota. Her current research interests include punishment, policing, victimization, youth, and the intersections of race, gender, and sexuality. Her dissertation explores youth responses to sexual violence within youth correctional facilities.

If Cosmo and Buzzfeed have taught us anything, it’s that we love personality quizzes. Sure, many of them aren’t valid measures of personality, but it can still be fun to find out what kind of Disney princess you are or what your food truck preference says about the way you handle rejection in life. 

Vintage Quiz from “The Girl Friend and the Boy Friend” Magazine May 1953 – via Envisioning the American Dream

But the logic behind these fun quizzes can has a big impact in social science, because they are all based on looking for patterns in how people answer questions. We can reverse-engineer the process; instead of going in with a set of personality types and designing a survey, researchers can use a method called Latent Class Analysis to look at completed surveys and see which patterns of answers emerge from the data. By comparing those patterns to existing theories, they can come up with new categories that explain how people think, especially people who fall in between the strong or obvious categories.

The Pew Research Center has done this with different styles of religious experiences, and you can take a quiz to see which type best fits you. 

Bart Bonikowski and Paul DiMaggio use this approach to identify different kinds of nationalism in the U.S. There are ardent nationalists and people who are disengaged from nationalism, but the middle is more interesting. Between these two groups, there are also people with relatively moderate national pride who still think only certain people are “truly American,” and there are folks who have higher national pride, but a more inclusive vision of who belongs.

I also used this method in a recent paper with Jack Delehanty and Penny Edgell looking at different kinds of religious expression in the public sphere. In a new paper coming soon, our team also finds patterns in how people think about who shares their vision for American society.

Religion, nationalism, and even racism? These are heavier topics than the typical personality quiz covers, but the cool part about this method is that it is less intrusive than directly asking people what they think about these topics. When we ask simpler questions—but more of them—and then look for patterns in the answers, we can learn a lot more about what they actually think.

Evan Stewart is an assistant professor of sociology at University of Massachusetts Boston. You can follow his work at his website, on Twitter, or on BlueSky.

In the United States, men have higher rates of life-threatening health conditions than women — including uncontrolled high blood pressure and heart disease. Recent research published in Socius shows they are also less likely than women to consider becoming vegetarian, and changing these eating habits may be important for their health and for the environment.

To learn more about meat and masculinity, Researchers Sandra Nakagawa and Chloe Hart conducted experiments to test whether a threat to masculinity influences men’s affinity to meat. In one experiment, the researchers told some men their answers from a previous gender identity survey fell in the “average female” range, while others fell into the “average male” range. The authors expected men who received “average female” results to feel like their masculinity was in question, and possibly express stronger attachment to meat on later surveys.

Men who experienced a threat to their masculinity showed more attachment to meat than those who did not experience the threat. They were also more likely to say they needed meat to feel full and were less likely to consider switching to a diet with no meat. This study shows how gendered assumptions about diet matter for how men think about maintaining their health, highlighting the standards men feel they must meet — and eat.

Allison Nobles is a PhD candidate in sociology at the University of Minnesota and Graduate Editor at The Society Pages. Her research primarily focuses on sexuality and gender, and their intersections with race, immigration, and law.