work


Katie L. sent along a fascinating Starbucks commercial. In it, a succession of workers grow, harvest, roast, taste, and prepare coffee from scratch for a hypothetical customer named “Sue.” At first glance, I thought that the commercial did a nice job of at least acknowledging their workers (if in an overly romanticized way), unlike some commercials for agricultural products that erase them.  But I thought again.  Because the entire commercial revolves around Sue, the inclusion of all the workers isn’t meant to focus our attention on them, it’s meant to highlight how much work goes into pleasing Sue.  We’re supposed to identify with Sue, not the series of workers.

This reminds me of a post about a “hand-rolled” tea sold at The Coffee Bean and Tea Leaf.  The consumer was supposed to be excited about the tea not because of its flavor, but because, as I wrote, “it takes a significant amount of human labor to “hand-roll” tea leaves into balls… What could be more luxurious than the casual-and-fleeting enjoyment of the hard-and-long labor of others? ”

This ad has a similar feel.  The workers are portrayed only in order to make the intended consumer feel special.  They work with Sue in mind, tending carefully to Sue’s future pleasure intently and with care.  They find satisfaction in Sue’s satisfaction.  Sue is everything.  Everyone is for Sue.

This tells us something interesting, no doubt, about American cultural values.

Lisa Wade, PhD is an Associate Professor at Tulane University. She is the author of American Hookup, a book about college sexual culture; a textbook about gender; and a forthcoming introductory text: Terrible Magnificent Sociology. You can follow her on Twitter and Instagram.

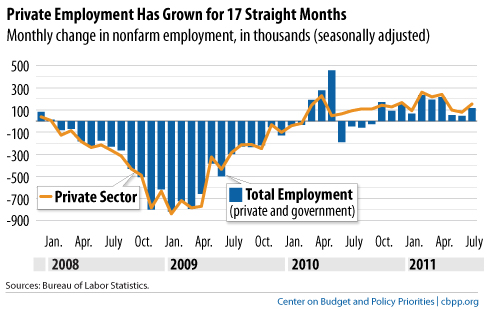
Laura E. sent in a link to the Off the Charts blog by the Center for Budget and Policy Priorities. They posted a set of charts highlighting ongoing unemployment in the U.S. Overall, the private sector has been adding jobs, but at generally very low levels:

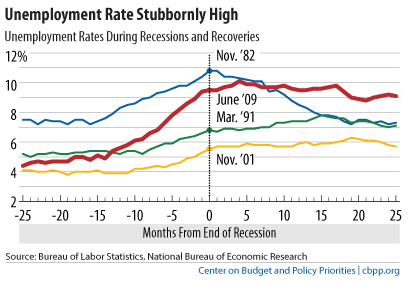
But we lost so many jobs relative to the overall working-age population during this recession that the slow job growth simply isn’t enough to significantly alter the unemployment rate, which is still hovering around 9% (though much higher for some groups, particularly young people and racial and ethnic minorities):

The increased labor force participation we saw during the 1990s and 200s have been erased:

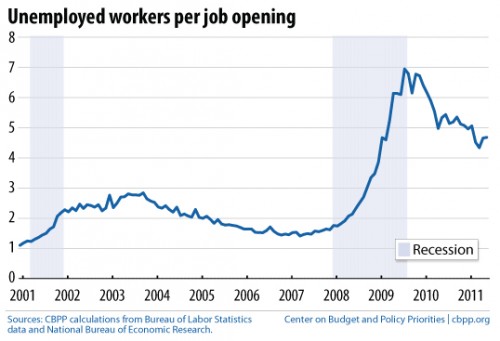
The CBPP has a collection of recession-related charts, including this graph of the number of individuals needing a job per each available job opening, a ratio that remains quite discouraging:

In the last few days since the debt ceiling fiasco, a number of economic experts have begun discussing the possibility of a double-dip recession and, as you may have heard, last night Standard & Poor’s downgraded the U.S. debt rating. Overall, it’s not an encouraging picture of our immediate economic future.

Cross-posted at Scientopia.

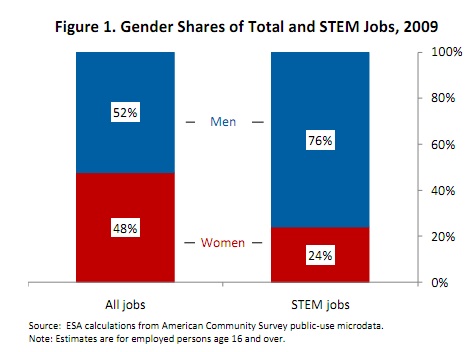
The U.S. Department of Commerce just released a report on the continuing gender gap in STEM jobs – that is, science, technology, engineering, and math. While women make up roughly half of the total paid workforce, they still held only a quarter of STEM jobs as of 2009:

In fact, we saw no change in the gender make-up of STEM fields between 2000 and 2009.

There is significant variation in the gender composition within the STEM category, however. At the high end, women hold 40% of jobs in the physical and life sciences; the low point is engineering, where only 14% of employees are women. And the proportion of women in computer science and math jobs actually fell between 2000 and 2009, from 30% to 27% of workers.

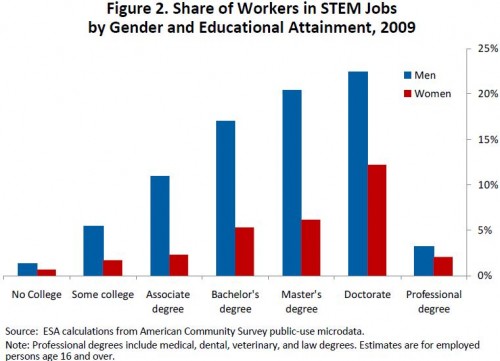
This isn’t simply because of differences in education, either. Here we see the proportion of both men and women in STEM jobs at various educational levels; while increased education correlates with a higher likelihood of having a STEM job for both groups, women are significantly less likely than men at every educational level to have a STEM job:

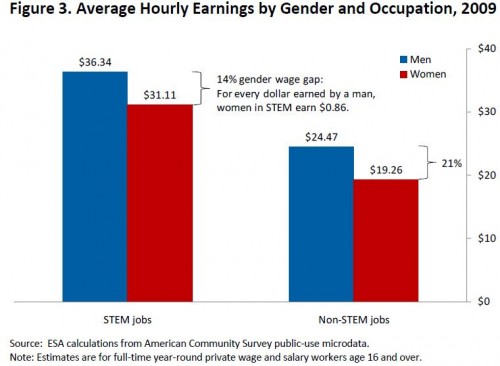
The gender disparity in STEM jobs is especially noteworthy because, on average, STEM occupations pay significantly more than other private-sector jobs, and the gender gap in pay is actually lower than in non-STEM sectors:

If we look only at women with bachelor’s degrees, women who earn STEM degrees and work in STEM jobs earn, on average, 29% more than other women.

So the underrepresentation of women in STEM jobs means that women are missing out on some of the best-paying occupations in the U.S.; in fact, this type of gender-segregation of jobs is one of the leading causes of gender gap in yearly and lifetime earnings.

The authors of the report don’t go into detail about potential causes of the gender gap in STEM careers, though they note that among those earning STEM degrees in college, women are significantly less likely than men to hold jobs in related STEM fields. They suggest this might be because STEM jobs are relatively unaccommodating to those who take time off for family obligations (disproportionately women), because of a lack of female role models in STEM fields (including as college professors), or because of gender stereotyping about math or science aptitude (like this, or this if you prefer a t-shirt) that pushes women away from STEM degrees and careers. [UPDATE: Broken links fixed!]

The complex interplay of factors that lead to a gender gap in who holds STEM-sector jobs provides significant challenges to increasing the proportion of women in these occupations — as indicated by the lack of change over the past decade. But particularly as we see increasing economic divergence between well-paid tech and information sector and low-paid service sector jobs, addressing the underrepresentation of women in STEM jobs will be essential as part of any effort to improve women’s lifetime earnings potential and overall economic outlook.

Cross-posted at Family Inequality.

The news each month is usually on unemployment rates, weekly filings of new claims, layoffs and new hiring. And the Pew report on widening race/ethnic wealth gaps was eye-opening. But you can take the measure of the recession overall maybe best with the employment rates — how many people have jobs? By that measure, the news is flat-to-down without letup. The Black-White discrepancy in the trends is increasing.

Here is the employment trend for White and Black women, showing that Black women had higher employment rates before the recession, but they’ve fallen more than twice as much as White women’s (a drop of 5.7% versus 2.4% as of June):

Source: Bureau of Labor Statistics data.

For men, the gap is bigger and the lines further apart, so I added a ratio line to help show the gap. Black men’s rate has fallen 5.6%, compared with 3.8% for White men:

The Christian Science Monitor has an article reviewing some of the factors that contribute to the unemployment gap for men, including education, incarceration and discrimination. And the Center for American Progress has more detail in this report, which argues that declines in manufacturing and public employment are increasing the Black-White gaps especially in this recession.

What the broader statistics don’t show as well is the tenuousness of the jobs Black workers have compared to Whites generally — working for weaker firms, in more segregated jobs, as a result of a racialized sorting process, which put them at higher risk of job loss in a recession (even without discrimination in firing decisions, which there is, too).

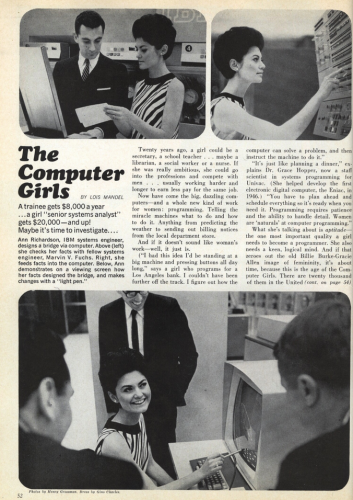
Today, the field of computer science is heavily male-dominated — men earn the vast majority of undergraduate and Ph.D. degrees in the field. But this wasn’t always true. When computers were first developed, we weren’t sure what kind of job programming was, whether a highly technical scientific occupation or a more secretarial-type one akin to being a typist. The fluidity of the developing field initially attracted significant numbers of women.

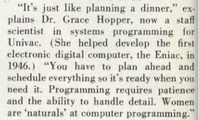
Anjan G. sent in an example of the normalization of computer programming as a female occupation, posted at Fog Creek. This article appeared in a 1967 issue of Cosmopolitan and quotes computer scientist Dr. Grace Hopper, a pioneer in the field, discussing why programming is a perfect fit for women — by drawing partly on gender stereotypes by assuming women are “naturals” at programming because they’re patient and pay attention to details:

You can find a larger image here.

Also, if you’re interested, Fog Creek, a software company, looked at their own data to see if male and female job applicants have equal chances of getting hired, and they posted an interview with the only woman working on their technical staff, an intern.

Back when we were kind of obsessed with “man” and “woman” symbology — e.g., whether traffic lights ever include female figureshow stick figures tend to be male, unless they’re parenting, the weird world of default avatars, and also this interesting alternative symbol for disability — I had considered writing a post featuring the then-stewardess, now-flight attendant icon seen on airplanes.  Airplanes have a longer life than cars and, so, many of the airplanes operated by commercial companies still have the old stewardess icon: a friendly round head with a dress.  These were old planes though, I figured, so the post wouldn’t pack much of a punch. They were like that, back then, after all.

Lo and behold, MirandaB took a flight on Delta and snapped a photograph of an undeniably modern incarnation of the friendly round head:

Delta chose to use a digitally-skirted stick figure on its task screen.  Just to be clear, Delta still, in 2011, feels comfortable representing “flight attendants” as 100% female.  That’s a win with the language, a fail with the symbology.

According to the Bureau of Labor Statistics, women account for 81% of flight attendants, not 100% by a long shot.  But you can see why men might be reluctant to join their ranks.

Also in gender, sexism, and air travel: Sexism in Aviation, Then and Now, Selling Feminine Passivity, “Singapore Girls” and Emotion Work, and Fly the Unfriendly Skies.

Lisa Wade, PhD is an Associate Professor at Tulane University. She is the author of American Hookup, a book about college sexual culture; a textbook about gender; and a forthcoming introductory text: Terrible Magnificent Sociology. You can follow her on Twitter and Instagram.
The College Board has released data from an initiative with the aim of better understanding the educational pathways of men of color.  Their site includes testimonials from many of these men, in addition to the data below.  And they included Native American men, a group almost always left out of quantitative data analysis because they are such a small percent of total Americans (in a profound and tragic irony).  Here’s the data on what each group of men are doing after high school.

About 1/3 of African American and Hispanic men are enrolling in some sort of college, another 34 and 47%, respectively, face unemployment.  A significant proportion go straight into work.  The 5% incarceration rate for Hispanics, and the 10% rate for Blacks, is a sad testimony to the over-policing of poor, urban neighborhoods, racial profiling, and emphasis on prosecuting the crimes of the poor.

Native American men are significantly less likely than Black men to go to college or vocational school.  They are most likely to straight into a job or be unemployed.  While not all all Native American men live on reservations — not by a long shot, those that do are more likely to be unemployed because of the dismal economic profiles of many of these regions.

Asian men are more likely to enter postsecondary education than either Native American or Black men, but the 61% is balanced by a good 30% ending up unemployed.  This reflects the diversity of the Asian community.  Some Asian groups do very well in the U.S. — e.g., Japanese and Asian Indians — others are still struggling — e.g., Hmong and the Vietnamese.

The charts below compare men and women in each group.  Each, with the exception of Native Americans, reveals the feminization of postsecondary education and the relative advantage women see in the market (mostly because we’ve got a strong service economy that hires women disproportionately).

Hat tip to Sociology Lens.

Lisa Wade, PhD is an Associate Professor at Tulane University. She is the author of American Hookup, a book about college sexual culture; a textbook about gender; and a forthcoming introductory text: Terrible Magnificent Sociology. You can follow her on Twitter and Instagram.
Deeb Kitchen sent in an essay at The Brookings Institution with a graph comparing the number of hours worked and earnings in middle-class, two-parent households (the 10% of households that are in the very middle of the income distribution).   Controlling for inflation (results are in 2009 dollars), we see that these households are earning more, for sure, but also working more.  In other words, they’re getting about as much buck for their bang as they were in 1975.

The authors of the post argue that the 26% increase in the number of hours worked is due mostly to mothers increasing their work hours.  Wages, as you can see below, have been stagnant for fathers, but gone up for mothers:

See also: more men and less women earning poverty wages and why did married mothers go to work.

Lisa Wade, PhD is an Associate Professor at Tulane University. She is the author of American Hookup, a book about college sexual culture; a textbook about gender; and a forthcoming introductory text: Terrible Magnificent Sociology. You can follow her on Twitter and Instagram.