work

The start of the Fall semester has inspired me to re-post this fascinating phenomenon we covered last year.

—————————

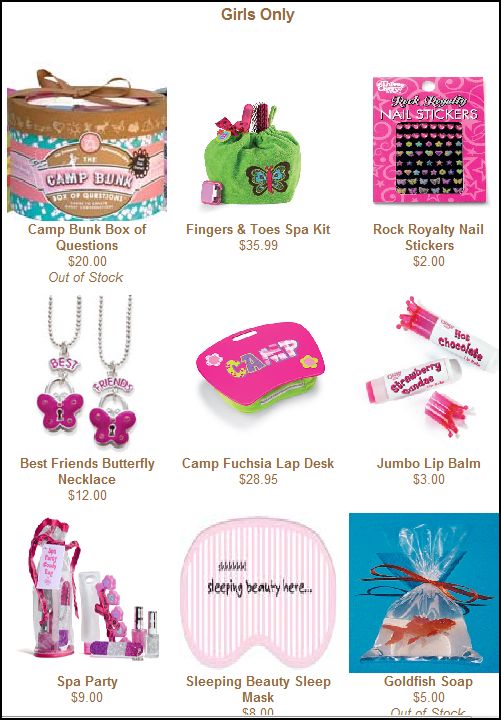
Rigby B. sent a link to the Just4Camp website to show us how care package products were gendered for “only” girls and boys. And, indeed, they were (screen shots below). But what is even more fascinating to me about this is the commodification of care.

The term “commodification” refers to the process by which something done for free becomes something done for money. Ever since the institutionalization of the wage, more and more things have become commodified. One particularly interesting category is care or what sociologists like to call “care work.”

Care work includes all of those tasks that involve nurturing and maintaining others: nursing, parenting, teaching, tending a home, etc. At one time in history, none of these things were paid jobs, but we have increasingly commodified them so that now paid nurses staff hospitals, home care workers take care of ailing elders, children spend the day in day care, professional teachers educate them, and housecleaners and gardeners can be paid to tend our homes and yards.

The care package is an example of care work.  I still remember getting care packages in college with my favorite home made cookies and other things my parents thought I would like or needed.  They take a lot of effort: thoughtfulness, shopping, baking, packaging, and mailing.  And, here, we have an example of the commodification of that effort.  The “care” in “care package” has been, well, outsourced.

Gendered care package ingredients:

For more on commodification, peruse our tag by that name.

Lisa Wade, PhD is an Associate Professor at Tulane University. She is the author of American Hookup, a book about college sexual culture; a textbook about gender; and a forthcoming introductory text: Terrible Magnificent Sociology. You can follow her on Twitter and Instagram.

A longer version is cross-posted at Montclair SocioBlog.

Long before the Freakonomics guys hit the best seller list by casting their economic net in sociological waters, there was Gary Becker.  If you want to explain why people (some people) commit crimes or get married and have babies, Becker argued, just assume that people are economically rational.  Follow the money and look at the bottom line.  You don’t need concepts like culture or socialization, which in any case are vague and hard to measure.*

Becker wrote no best-sellers, but he did win a Nobel.  His acceptance speech: “The Economic Way of Looking at Behavior.”

In a Wall Street Journal op-ed Friday about the recession, Becker started off Labor Day weekend weighing in on unemployment and the stalled recovery.  His explanation: in a word, uncertainty.

These laws [financial regulation, consumer protection] and the continuing calls for additional regulations and taxes have broadened the uncertainty about the economic environment facing businesses and consumers. This uncertainty decreased the incentives to invest in long-lived producer and consumer goods. Particularly discouraged was the creation of small businesses, which are a major source of new hires.

There’s something curious about this.  Becker pushes uncertainty to the front of the line-up and says not a word about the usual economic suspects – sales, costs, customers, demand.  It’s all about the psychology of those in small business, their perceptions and feelings of uncertainty.  Not only are these vague and hard to measure, but as far as I know, we do not have any real data about them.  Becker provides no references.  The closest thing I could find was a small business survey from last year, and it showed that people in small business were far more worried about too little demand than about too much regulation.

Compared with Regulation, twice as many cited Sales as the number one problem.  (My posts on uncertainty from earlier this summer are here and here.)

In addition, the sectors of the economy that should be most uncertain about regulation – finance, mining and fuel extraction, and medical care – are those where unemployment is lowest.

More, as David Weidner writes in the Wall Street Journal, taxes, interest rates, and regulation at an all-time low.

[The uncertainty-about-taxes-and-regulation argument] would make more sense if, say, taxes were already high and might be going higher or regulatory burdens were heavy and might be getting heavier. But when taxes are at a 60-year low and the regulations are pretty much the same as they were in the 1990s boom, the argument makes no sense at all (Mark Thoma quoting an e-mail from Gary Burtless).

If it’s really uncertainty caused by these things that causes a reluctance to hire, the time to invest and hire should be now.

—————————

* This is an oversimplified version, but it will do for present purposes.

In honor of Labor Day here in the U.S., my coworker Pete posted this video someone put together of images from various labor strikes, protests, etc., set to the Dropkick Murphy’s version of “Which Side Are You On?”, originally written by Florence Reece in 1931 in response to intimidation of her family during struggles between workers and coal mine owners in Harlan County, Kentucky:

The Dropkick Murphys’ “Worker’s Song” seems equally apropos:

College is a good investment. Yes, still.  But, as this graph sent in by Deeb shows, entry level wages for college graduate, controlled for inflation, have shown quite a bit of variance over the last 30 years.  Starting salaries are consequential.  For many jobs raises are calculated as a proportion of your existing salary, such that starting salaries have cumulative effects over the lifetime.

Today’s college graduates, according to the Economic Policy Institute, will have an average starting salary of $1.00 less than ten years ago:

Lisa Wade, PhD is an Associate Professor at Tulane University. She is the author of American Hookup, a book about college sexual culture; a textbook about gender; and a forthcoming introductory text: Terrible Magnificent Sociology. You can follow her on Twitter and Instagram.

That’s Facebook founder Mark Zuckerberg and, behind him, his “law of information sharing.” The equation and graph illustrate, in his own words:

…that next year, people will share twice as much information as they share this year, and next year, they will be sharing twice as much as they did the year before.

The norms surrounding privacy are changing and new apps and services for us to display ourselves are being invented. Because of this, Zuckerberg predicts that we will share more and new types of information as time passes.

Facebook and the rest of social media (Twitter, Tumblr, Google+ and so on) need us to share more and more information. Facebook, for instance, uses our personal information to attract advertisers who want to better “target” their advertisements to us. Change your relationship status to “engaged” and you may be quickly targeted with wedding ads.

So what? 

Karl Marx said that we are “exploited” when we are not paid in wages the full value of our labor (our bosses, instead, skim some off the top).  Since our sharing makes Facebook valuable, it is our work that makes it the digital goldmine that it is (valued at around $84 billion). We, in turn, are paid no wages at all.

Should the average Facebook user feel exploited? 

Facebook users get non-monetary rewards from using the site, such as self-expression and socializing with others.  Perhaps personal connection or social attention is just another type of currency, one that Marx didn’t fully account for.  Then again, Marx never argued that workers weren’t compensated at all, only that their compensation was not equal to the value they brought to the employer.

So, what do you think? Is Facebook exploitative? Are monetary and social currencies fundamentally different?

Does a Marxist analysis work on Facebook? Or do we need a different theory to make sense of it all?

——————————

Nathan Jurgenson is a graduate student in sociology at the University of Maryland and co-edits the Cyborgology blog.

If you would like to write a post for Sociological Images, please see our Guidelines for Guest Bloggers.

Attention upper-middle class white women: help save poor Indian women from a life of forced prostitution, all from the comfort of your hammock! Simply purchase some comfy, trendy pants.

(Image from International Princess Project, the organization behind Punjammies)

Aliyah C. wrote to us about a series of photos on a website for a product called Punjammies. The images offer a stark illustration of the racial, classed, and gendered nature of many “development” initiatives.

According to their website, Punjammies claims to offer Indian women who have escaped forced prostitution a chance to rebuild their lives by providing them with the marketable skill of manufacturing clothing.

Images in the Punjammies catalogue make it clear who the target market is: They feature exclusively white women, luxuriously lounging about in Punjammies attire.

Meanwhile, images on the “About” page depict the women purportedly empowered by this operation, conducting manual labour to produce Punjammies products.

Consumerism-driven development initiatives like Punjammies fail to challenge the inherent inequalities at play in a situation where wealthy, white women in the developed world are seen as benevolent and charitable for making a purchase, while women in developing countries manufacturing the products are portrayed as beneficiaries. Furthermore, as Barbara Heron might argue, Punjammies is a prime example of how development initiatives often play into notions of white female subjectivity as compassionate and caring, dependent upon the Othering of women of colour in the south.  In fact, since colonialism, the advantages that accrue to those of us in developed countries have been linked to the disadvantages faced by the rest of the world. Our economies are not separate entities, they are intimately linked.

Reflecting upon images like these should remind us to remain critical of the ways in which “development” is marketed to us, and how it can perpetuate rather than challenge inequalities.


Reference: Heron, B. (2007). Desire for Development: Whiteness, Gender and the Helping Imperative. Waterloo: Wilfred Laurier University Press.

Hayley Price has a background in sociology, international development studies, and education. She recently completed her Masters degree in Sociology and Equity Studies in Education at the University of Toronto.

The U.S. economy is in trouble and that means trouble for the world economy.

According to a United Nations Conference on Trade and Development report, “Buoyant consumer demand in the United States was the main driver of global economic growth for many years in the run-up to the current global economic crisis.”

Before the crisis, U.S. household consumption accounted for approximately 16 percent of total global output, with imports comprising a significant share and playing a critical role in supporting growth in other countries.

…as a result of global production sharing, United States consumer spending increas[ed] global economic activities in many indirect ways as well (e.g. business investments in countries such as Germany and Japan to produce machinery for export to China and its use there for the manufacture of exports to the United States).

In short, a significant decline in U.S. spending can be expected to have a major impact on world growth, with serious blow-back for the United States.

There are those who argue that things are not so dire, that other countries are capable of stepping up their spending to compensate for any decline in U.S. consumption. However, the evidence suggests otherwise.As the chart below (from the report) reveals, consumption spending in the U.S. is far greater than in any other country; it is greater than Chinese, German, and Japanese consumption combined.

consumption.jpg

Moreover, there is little reason to believe that the Chinese, German, or Japanese governments are interested in boosting consumer spending in their respective countries.  All three governments continue to pursue export-led growth strategies that are underpinned by policies designed to suppress wage growth (lower wages = cheaper goods = stronger competitiveness in international markets).  Such policies restrict rather than encourage national consumption because they limit the amount of money people have to spend.

For example, China is the world’s fastest growing major economy and often viewed as a potential alternative growth pole to the United States.  Yet, the Economist reveals that the country’s growth has brought few benefits to the majority of Chinese workers.

picture1.jpg

According to the U.S. Bureau of Labor Statistics, despite several years of wage increases, Chinese manufacturing workers still only earn an average of  $1.36 per hour (including all benefits).  In relative terms, Chinese hourly labor compensation is roughly 4 percent of that in the United States.   It even remains considerably below that in Mexico.

Trends in Germany, the other high-flying major economy, are rather similar. As the chart below shows, the share of German GDP going to its workers has been declining for over a decade.  It is now considerably below its 1995 level.  In fact, the German government’s success in driving down German labor costs is one of the main causes of Europe’s current debt problems — other European countries have been unable to match Germany’s cost advantage, leaving them with growing trade deficits and foreign debt (largely owed to German banks).

germany.jpg

The Japanese economy, which remains in stagnation, is definitely unable to play a significant role in supporting world growth.  Moreover, as we see below, much like in the United States, China, and Germany, workers in Japan continue to produce more per hour while suffering real wage declines.

japan.gif

For a number of years, world growth was sustained by ever greater debt-driven U.S. consumer spending.  That driver now appears exhausted and U.S. political and economic leaders are pushing hard for austerity.  If they get their way, the repercussions will be serious for workers everywhere.

Our goal should not be a return to the unbalanced growth of the past but new, more stable and equitable world-wide patterns of production and consumption.  Achieving that outcome will not be easy, especially since as the United Nations Conference on Trade and Development’s World Investment Report 2011 points out, transnational corporations (including their affiliates) currently account for one-fourth of global GDP.Their affiliates alone produce more than 10 percent of global GDP and one-third of world exports.  And, these figures do not include the activities of many national firms that produce according to terms specified by these transnational corporations.   These dominant firms have a big stake in maintaining existing structures of production and trade regardless of the social costs and they exercise considerable political influence in all the countries in which they operate.

Sangyoub Park let us know that the Bureau of Labor Statistics has released the results of the 2010 American Time Use Survey, a study that looks at what we do with our time. They haven’t released any charts of the 2010 data yet, but the Wall Street Journal posted an article with an image that summarizes the changes since 2007, before the recession began. Not surprisingly, on average Americans are spending less time working and more time sleeping and watching TV, among other activities:

Keep in mind those numbers are daily averages that even out activity that is often not evenly distributed in real life (such as work, where weekly hours worked are averaged across all 7 days).

These changes seem insignificant when you look at them; so what if Americans are, on average, sleeping 5 extra minutes a day, or spending 2 minutes less buying things? But when aggregated across the entire U.S. population aged 15 years or older, these add up to major shifts in family and work life as well as economic activity.

There’s a video to accompany the story:

Finally, they have an interactive website where you can enter your own time use in major categories (to the best you can estimate it) and see how you compare to national averages.

We’ll follow up with more detailed posts once the BLS starts posting relevant charts.