race/ethnicity

Data from the Pew Research Center shows us the extent to which the recession has hurt the economic health of American households, especially the middle and working classes:

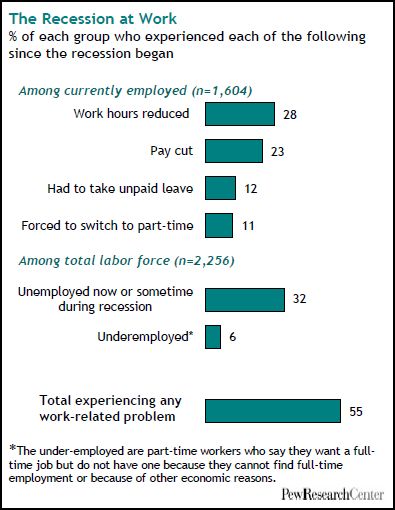
More than half of all Americans report some sort of work-related disruption:

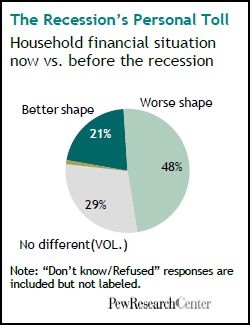
Nearly half state that they are worse off than they were before the recession:

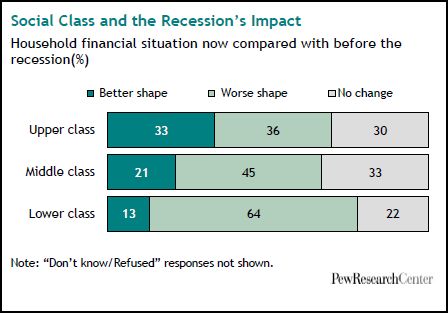
An additional four percent (since 2008) identify themselves as lower class:
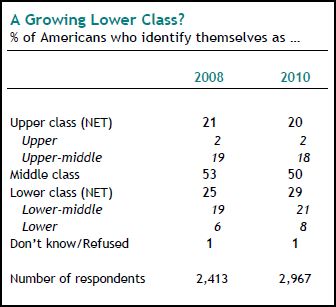
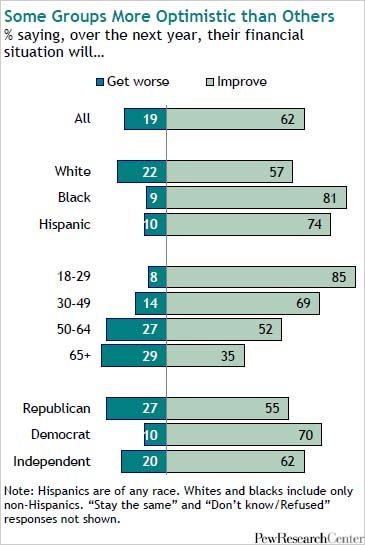
Pew specifies:

Blacks, as a group, are an exception to this overall pattern. The share of blacks who now identify with the upper class has gone up during this recession, to 20% now from 15% two years ago.

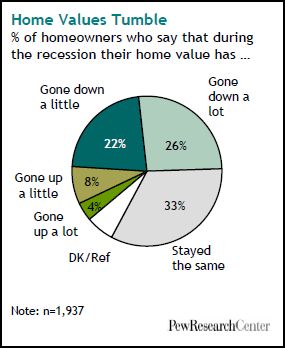
Forty-eight percent have lost equity in their homes:

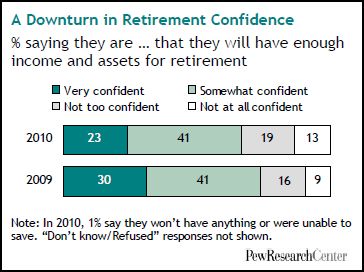
Sixty percent of Americans fear that they may have to delay retirement:

A larger percentage lack the confidence that they have enough income and assets for retirement, even compared to last year:

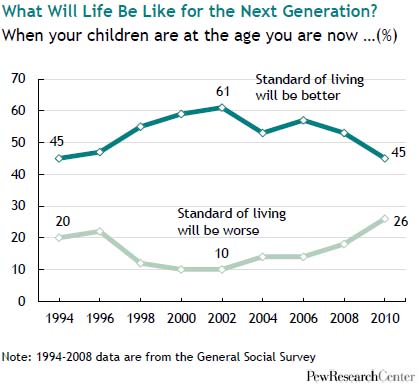
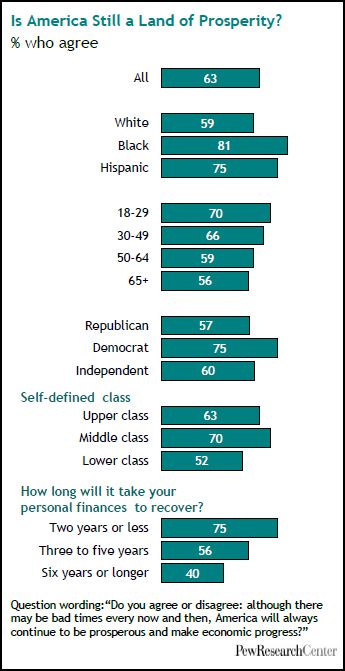
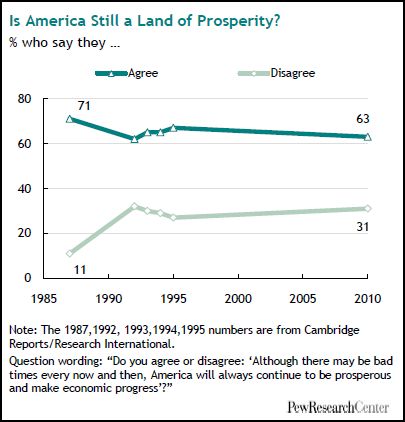
“Is America still a land of prosperity?”

The question in some historical perspective:

Lisa Wade, PhD is an Associate Professor at Tulane University. She is the author of American Hookup, a book about college sexual culture; a textbook about gender; and a forthcoming introductory text: Terrible Magnificent Sociology. You can follow her on Twitter and Instagram.

This is not a major social issue, and I am not going to make it one. Rather, I think the way this story is being presented in the media effectively illustrates how race matters and is constructed in particular social contexts. Among track and field (“athletics”) aficionados, the 100 meters is frequently considered the premier event. At the elite level, the 100 meters is a power sprint, measuring fast twitch, explosive, kinetic energy manifested through meticulously honed technique.

For males, breaking the 10-second mark is still a colossal accomplishment. One might not think so since track and field doesn’t get much media attention in general (at least not in the United States), and when it does, we’re now more accustomed to watching Usain Bolt blast away his competitors, seemingly cruising to numerous sub-10-second performances (his world record currently stands at 9.58). A few weeks ago sprinter Christophe Lemaitre won France’s national competition with a time of 9.98 second, squeaking below that 10-second mark.  A typical headline of Lemaitre’s accomplishment (from Reuters.com, July 9, 2010):

Lemaitre first white man to run 100m in under 10 seconds

And from the article:

PARIS (Reuters) – France’s Christophe Lemaitre became the first white man to run the 100 meters in under 10 seconds when he clocked 9.98 on Friday, the French athletics federation said.

Lemaitre, 20, set his time during the French championships in Valence, southern France.

“He is the first white man to run the 100 meters in less than 10 seconds,” Jean-Philippe Manzelle, French athletics Federation press officer, told Reuters.

There have been other white sprinters who have excelled at the world level in recent years. Lolo Jones comes to mind in the 100m hurdles; Jeremy Wariner dominated the open 400m in recent years. And if we’re talking sprinters of “outlier” ethnicities in general, Liu Xiang of China recently held the world record in the 110m hurdles. But the early discourse around Lemaitre could be a bit more pointed in the way he is being constructed through the media as a great white hope.

When should race matter in sport, and when it does, how should it be discussed? In this case, at the very least, Lemaitre’s race is framed such that his being “white” is of greater importance than his win. As the track and field season moves on and should Lemaitre continue to run sub-10-second times, I expect to see increased media coverage about his whiteness. He is not going to beat Usain Bolt or America’s top sprinters at international competitions. But on the European circuit, I expect he will make waves. Mainstream media discussion of his success or failure should be interesting to follow.

————————-

David Mayeda is adjunct faculty at Hawaii Pacific University in the Department of Sociology and Legal Studies, where he will also come on board as Assistant Professor this coming fall semester.  His recent book publications include Celluloid Dreams: How Film Shapes America and Fighting for Acceptance: Mixed Martial Artists and Violence in American Society.  He also blogs at The Grumpy Sociologist.

If you would like to write a post for Sociological Images, please see our Guidelines for Guest Bloggers.

Lisa Wade, PhD is an Associate Professor at Tulane University. She is the author of American Hookup, a book about college sexual culture; a textbook about gender; and a forthcoming introductory text: Terrible Magnificent Sociology. You can follow her on Twitter and Instagram.

Pew Research Center has released data suggesting an age gap in optimism for the future of American young adults.

When asked if their children will be better off or worse off than they are, less than half of U.S. parents say “better off” and a full 25 percent say “worse off.”  This is the most pessimistic we’ve seen parents in 16 years.

But their kids are more optimistic than anyone else, with 85% saying that they expect that their financial situation will improve next year:

Of course these data aren’t entirely compatible, but it’s an interesting comparison nonetheless.  The idealism of youth?  The pessimism that comes with bad backs and mortgage payments?  The possibility that 18-29-year-olds have nowhere to go but up?

Economix, via Karl Bakeman.

Lisa Wade, PhD is an Associate Professor at Tulane University. She is the author of American Hookup, a book about college sexual culture; a textbook about gender; and a forthcoming introductory text: Terrible Magnificent Sociology. You can follow her on Twitter and Instagram.

Re-posted at Drawing On Indians.

Rob Walker (author of the fascinating book Buying In: What We Buy and Who We Are) sent me a link to a post at Drinkin’ and Dronin’ of a 1954 Levi Strauss brochure about “western Indian lore.” It’s a nice round-up of stereotypes and appropriations of Native Americans. We start off with an angry, bare-chested (and Levis-clad) man with a tomahawk, shield, moccasins, and headdress; I’d guess he’s supposed to be a warrior doing a war dance:

Then some descriptions of items associated with different tribes and the obligatory broken English (“just want ‘um”) familiar to anyone who watched The Lone Ranger and paid attention to Tonto:

I have no idea how accurate their descriptions of “unusual Indian weapons” are, but the overall tone of the brochure doesn’t inspire a lot of confidence.

And we have a lesson on “the Indian sign language,” the origins of which are “lost in the mists of time”:

Related posts: Potowatamis didn’t have a word for “global business center,” “discovering” Newfoundland, appropriation of Native Americans in fashion, teaching kids how to be American Indians, marketing the Vancouver Olympics, ice skaters dress up like Australian aborigines, native cultures in Avatar, Poca-Hotness, Indian costume for your dog, Indian Halloween costumes, Disney depicts Native Americans, “my skin is dark but my heart is white,” American Indians on t-shirts, sports mascots, Playmobil’s American Indian family, Howe Nissan’s American Indian statue, the “crying Indian” anti-litter PSA, Native Americans in Italian anti-immigration posters, and more American Indian dolls.

Also check out Adrienne K.’s blog Native Appropriations for lots of examples.

The New York Times has a neat interactive graph based on data from the American Time Use Survey that lets you look at hour-by-hour time use broken down by sex, employment status, 3 racial/ethnic groups (White, Black, Hispanic), age, education, and number of children (though, unfortunately, you can’t search by more than one category at once). Here is the breakdown for the entire sample:

For people age 15-24:

Watching TV and movies takes up a lot of the time of those over age 65:

You can also click on a particular activity to get more information about it:

Those with advanced degrees spent the most time participating in sports or watching them in person; I suspect that the data might look a bit different if time spent watching sports on TV went in this category instead of the TV category:

Just a note, the averages for time spent at work seem pretty low, but that’s because they’re averaged over all days of the week, including any days off, rather than only days a person actually went to work.

Presumably the amount of time you’ll spend playing around with the site goes under computer use.

We’ve written several posts about how the words “nude” and “flesh” tend to be used to refer to colors associated with light-colored skin.  For examples, see our posts on “flesh-colored,” Michelle Obama’s “nude” colored dress, the new in-color, “nude is the new black” (and by black we mean white), lotion for “normal to darker skin,” and color-assisted medical diagnosis.  Readers have sent in an additional example and several counter-examples.

Catherine M.P. snapped this photo of an ad for Ripley in Santiago, Chile (she says English is often used to make a product seem “edgy”):

Lisa Wade, PhD is an Associate Professor at Tulane University. She is the author of American Hookup, a book about college sexual culture; a textbook about gender; and a forthcoming introductory text: Terrible Magnificent Sociology. You can follow her on Twitter and Instagram.

Teresa L.-M. sent us a link to an article at Color Lines about a survey of 3,413 people conducted by several groups, including Time magazine and the Center for American Progress, about attitudes toward a variety of issues including changes in women’s work and family roles. Overall, we see that every group said that women’s increased participation in the paid workforce has been good for the U.S., but not surprisingly, some groups were more enthusiastic than others:

This includes those who said it has been “somewhat” or “very” positive.  The % for Latinas was highlighted in the original because the memo focused on the fact that Latinos and Latinas, despite stereotypes that they hold more “traditional” gender attitudes, reported more positive feelings about increased workforce participation than did men and women as a whole. Hispanics were somewhat oversampled — that is, more were included than you would expect relative to their proportion in the U.S. population — because the organizations conducting the survey wanted to get more detailed information about Latino/a attitudes. The results indicated that “Latino attitudes were basically in line with those of other groups on nearly every indicator in the survey. Some minor differences did emerge in terms of the intensity of these beliefs and the degree of consensus about an issue.”

Also, obviously the categories above are not mutually exclusive, they just illustrate some interesting differences when you sort on various characteristics.

One area where Latinos/as differed was that they were more likely to report having an “interesting career” as the most important thing for their daughters to have, and less likely to say marriage and family is the most important, compared to all men and women, which is the opposite of what stereotypes of Latinos and Latinas would predict:

But I can’t help but note the wording there: “Everyone naturally wants the best of all things for their children…” That’s sloppy survey writing there, because it’s leading — it implies that a certain attitude or desire is universal and normative, and implies that everyone would agree that the three items they include in the question are examples of “the best.” It’s not that I’m saying most parents want their daughters to have miserable marriages or shitty jobs they hate. But you always want to be careful about wording questions in ways that take beliefs or values for granted, and thus set up a situation where contradicting them puts the respondent in the position of feeling deviant or fearing disapproval from the interviewer. I don’t know that in this particular example, that wording would have a huge impact on responses, since participants had to rank 3 specific items relative to one another. But I’d be very concerned if they had then been asked how important each item was (rather than asked to rank them), since the wording might lead people to rate items more highly than they would otherwise, because that’s what parents “naturally” want for their kids.

Anyway, moving on. Latinos/as were less concerned about children growing up without a full-time stay-at-home parent than were men  and women overall, with Latinas expressing significantly less negative attitudes than women overall and Latino men (this includes those who answered “very” or “somewhat” negative):

Back to methodological quibbling, this next graph is a great example of slippage between what the graph shows and what the heading claims it shows. As we see, the title says it indicates that Latinos are “more likely to turn to one another for decision making and financial support”:

But that’s not what the data are about at all. The question wording makes it clear this is both hypothetical (including people who don’t have a romantic partner and thus may be answering based on what they suppose would be true if they did) and is about how they value these things (“how important you feel it is for you personally…”), which is very different than if they regularly do them. The fact that you feel that it’s very important to have a romantic partner who provides financial support does not mean you are, in fact, turning to another person for financial support.

Of course, the heading for the table was written after the data were gathered and analyzed, and it doesn’t necessarily indicate that the data themselves are problematic. And yet, along with the wording issue above — and these are just two things I noticed in the memo that summarizes a few of the findings — it makes me a bit hesitant. The topic is interesting, and the results, which seem to undermine stereotypes about Latinos/as, would be great to use…except the methodological issues are overshadowing what might be perfectly valid, useful, and insightful findings. So ultimately, I present the images here less as information on attitudes about women’s roles and more as a cautionary tale.

And, you know, feel free to let me know if you think I’m over-reacting.

Deepa D. sent in an interesting post from Racebending about the race/ethnicity and gender of stars who get top billing in Paramount movies. Three volunteers at Racebending analyzed relevant data on movies produced or distributed by Paramount Pictures since 2000, as well as those currently in development. They focused on top billing — that is, which stars are most frequently highlighted in promotional materials, whose names appear highest in the credits, and so on. This both reflects power and status in Hollywood (the more prestige you have, the higher you’re likely to be credited compared to lower-status stars with similar screen time) and contributes to it (higher billing leads to more exposure and attention. Racebending explains:

Various types of Credit include Main Title Credit (before the movie starts), End Title Credit (after the movie is over), Paid Advertising Credit (mention during commercials and publicity), Above-the-Title Credit (name shows up on top of the movie name in promos and on screen), and Billing Block Credit (the block of text on posters and trailers.)

Their methodology:

For our review, we simply looked at which actor is listed first on imdb.com. Even if several actors have received top billing or above the title billing, someone is always listed first…

Our review of actors in top billing was necessarily subjective, but the cultural ethnicity and gender of most of Paramount’s top-billed actors like John Travolta, Angelina Jolie, and Samuel L. Jackson are well established in the public sphere. For animated characters like Shrek the Ogre, Spongebob Squarepants, and Eliza Thornberry we looked to the gender and ethnicity of the voice actor. We simply tallied the first actor billed, (for example: Malin Ackerman in Watchmen, Chris Pine in Star Trek, Ben Affleck in The Sum of All Fears, Jamie Foxx in The Soloist, Noah Ringer in The Last Airbender.)

The analysis found that the vast majority of top-billed stars in Paramount films from 2000 to 2009 are male, while movie audiences are about 45% male:

An even higher proportion — 86% — of top-billed stars are White (the green bars show each groups percent of the overall U.S. population):

The category White there specifically includes White non-Hispanics. No Latinos had top billing in Paramount movies during this time period. Also,

Out of 133 movies either produced or distributed, 17 had a black lead actor and only one had an Asian actor–Parry Shen in the film Better Luck Tomorrow (2002). However, Paramount did not produce Better Luck Tomorrow, the company distributed the film to theaters after the film made the independent film circuit.

When the data are broken down by race/ethnicity and gender, we see that the vast majority of top-billed stars who are non-White are men. Non-White women are almost entirely shut out:

The chart on the right represents films currently under development. While Whites predominate in the starring roles in these projects, notice that White women make up only 6% of top-billed stars, and non-White men make up about twice that proportion.

This is, of course, just one studio. If you have links to similar data on other studios, or on movies more generally, send them in!

Related posts: the Bechdel test, the real stars of Glee, underrepresenting women in Hollywood, the Smurfette principle, whitening Heroes, White actors in yellowface, casting cheat sheet, Hollywood’s discomfort with Asian lead characters, race in Transformers II, gender in Pixar films, racist Disney characters, and the gender hierarchy in Bee Movie.