methods/use of data

In the 6-minute video below, Stanford sociologist Aliya Saperstein discusses her research showing that the perception of other peoples’ race is shaped by what we know about them. She uses data collected through a series of in-person interviews in which interviewers sit down with respondents several times over many years, learn about what’s happened and, among other things, make a judgment call as to their race. You may be surprised how often racial designations. In one of her samples, 20% of respondents were inconsistently identified, meaning that they were given different racial classifications by different interviewers at least once.

Saperstein found that a person judged as white in an early interview was more likely to be marked as black in a later interview if they experienced a life event that is stereotypically associated with blackness, like imprisonment or unemployment.

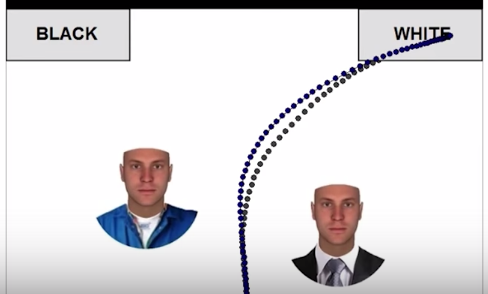
She and some colleagues also did an experiment, asking subjects to indicate whether people with black, white, and ambiguous faces dressed in a suit or a blue work shirt were white or black. Tracing their mouse paths, it was clear that the same face in a suit was more easily categorized as white than the one in a work shirt.

5

Race is a social construction, not just in the sense that we made it up, but in that it’s flexible and dependent on status as well as phenotype.

She finishes with the observation that, while phenotype definitely impacts a person’s life chances, we also need to be aware that differences in education, income, and imprisonment reflect not only bias against phenotype, but the fact that success begets whiteness. And vice versa.

Watch the whole thing here:

[youtube]https://www.youtube.com/watch?v=jiwieME2tis[/youtube]

The Colbert Report also referenced Saperstein’s work:

Lisa Wade, PhD is an Associate Professor at Tulane University. She is the author of American Hookup, a book about college sexual culture; a textbook about gender; and a forthcoming introductory text: Terrible Magnificent Sociology. You can follow her on Twitter and Instagram.

Flashback Friday.

In the talk embedded below, psychologist and behavioral economist Dan Ariely asks the question: How many of our decisions are based on our own preferences and how many of them are based on how our options are constructed? His first example regards willingness to donate organs. The figure below shows that some countries in Europe are very generous with their organs and other countries not so much.

Capture1

A cultural explanation, Ariely argues, doesn’t make any sense because very similar cultures are on opposite sides: consider Sweden vs. Denmark, Germany vs. Austria, and the Netherlands vs. Belgium.

What makes the difference then? It’s the wording of the question. In the generous countries the question is worded so as to require one to check the box if one does NOT want to donate:

Capture3

In the less generous countries, it’s the opposite. The question is worded so as to require one to check the box if one does want to donate:

Capture2
Lesson: The way the option is presented to us heavily influences the likelihood that we will or will not do something as important as donating our organs.

For more, and more great examples, watch the whole video:

Originally posted in 2010.

Lisa Wade, PhD is an Associate Professor at Tulane University. She is the author of American Hookup, a book about college sexual culture; a textbook about gender; and a forthcoming introductory text: Terrible Magnificent Sociology. You can follow her on Twitter and Instagram.

The margin of error is getting more attention than usual in the news. That’s not saying much since it’s usually a tiny footnote, like those rapidly muttered disclaimers in TV ads (“Offer not good mumble mumble more than four hours mumble mumble and Canada”). Recent headlines proclaim, “Trump leads Bush…” A paragraph or two in, the story will report that in the recent poll Trump got 18% and Bush 15%.  That difference is well within the margin of error, but you have to listen closely to hear that. Most people usually don’t want to know about uncertainty and ambiguity.

What’s bringing uncertainty out of the closest now is the upcoming Republican presidential debate. The Fox-CNN-GOP axis has decided to split the field of presidential candidates in two based on their showing in the polls. The top ten will be in the main event. All other candidates – currently Jindal, Santorum, Fiorina, et al. – will be relegated to the children’s table, i.e., a second debate a month later and at the very unprime hour of 5 p.m.

But is Rick Perry’s 4% in a recent poll (419 likely GOP voters) really in a different class than Bobby Jindal’s 25? The margin of error that CNN announced in that survey was a confidence interval of  +/- 5.  Here’s the box score.

2
Jindal might argue that, with a margin of error of 5 points, his 2% might actually be as high as 7%, which would put him in the top tier.He might argue that, but he shouldn’t.  Downplaying the margin of error makes a poll result seem more precise than it really is, but using that one-interval-fits-all number of five points understates the precision. That’s because the margin of error depends on the percent that a candidate gets. The confidence interval is larger for proportions near 50%, smaller for proportions at the extreme.

Just in case you haven’t taken the basic statistics course, here is the formula.

4
The   (pronounced “pee hat”) is the proportion of the sample who preferred each candidate. For the candidate who polled 50%, the numerator of the fraction under the square root sign will be 0.5 (1-0.5) = .25.  That’s much larger than the numerator for the 2% candidate:  0.02 (1-0.02) = .0196.*Multiplying by the 1.96, the 50% candidate’s margin of error with a sample of 419 is +/- 4.8. That’s the figure that CNN reported. But plug in Jindal’s 2%, and the result is much less: +/- 1.3.  So, there’s a less than one in twenty chance that Jindal’s true proportion of support is more than 3.3%.

Polls usually report their margin of error based on the 50% maximum. The media reporting the results then use the one-margin-fits-all assumption – even NPR. Here is their story from May 29 with the headline “The Math Problem Behind Ranking The Top 10 GOP Candidates”:

There’s a big problem with winnowing down the field this way: the lowest-rated people included in the debate might not deserve to be there.

The latest GOP presidential poll, from Quinnipiac, shows just how messy polling can be in a field this big. We’ve put together a chart showing how the candidates stack up against each other among Republican and Republican-leaning voters — and how much their margins of error overlap.

14


The NPR writer, Danielle Kurtzleben, does mention that “margins might be a little smaller at the low end of the spectrum,” but she creates a graph that ignores that reality.The misinterpretation of presidential polls is nothing new.  But this time that ignorance will determine whether a candidate plays to a larger or smaller TV audience.

—————————–

* There are slightly different formulas for calculating the margin of error for very low percentages.  The Agresti-Coull formula gives a confidence interval even if there are zero Yes responses. (HT: Andrew Gelman)

Originally posted at Montclair SocioBlog.

Jay Livingston is the chair of the Sociology Department at Montclair State University. You can follow him at Montclair SocioBlog or on Twitter.

Lots of time and care consideration goes into the production of new superheroes and the revision of time-honored heroes. Subtle features of outfits aren’t changed by accident and don’t go unnoticed. Skin color also merits careful consideration to ensure that the racial depiction of characters is consistent with their back stories alongside other considerations. A colleague of mine recently shared an interesting analysis of racial depictions by a comic artist, Ronald Wimberly—“Lighten Up.”

“Lighten Up” is a cartoon essay that addresses some of the issues Wimberly struggled with in drawing for a major comic book publisher. NPR ran a story on the essay as well. In short, Wimberly was asked by his editor to “lighten” a characters’ skin tone — a character who is supposed to have a Mexican father and an African American mother.  The essay is about Wimberly’s struggle with the request and his attempt to make sense of how the potentially innocuous-seeming request might be connected with racial inequality.

In one panel of the cartoon, you can see Wimberly’s original color swatch for the character alongside the swatch he was instructed to use for the character.

Digitally, colors are handled by what computer programmers refer to as hexadecimal IDs. Every color has a hexademical “color code.” It’s an alphanumeric string of 6 letters and/or numbers preceded by the pound symbol (#).  For example, computers are able to understand the color white with the color code #FFFFFF and the color black with #000000. Hexadecimal IDs are based on binary digits—they’re basically a way of turning colors into code so that computers can understand them. Artists might tell you that there are an infinite number of possibilities for different colors. But on a computer, color combinations are not infinite: there are exactly 16,777,216 possible color combinations. Hexadecimal IDs are an interesting bit of data and I’m not familiar with many social scientists making use of them (but see).

There’s probably more than one way of using color codes as data. But one thought I had was that they could be an interesting way of identifying racialized depictions of comic book characters in a reproducible manner—borrowing from Wimberly’s idea in “Lighten Up.” Some questions might be:

  • Are white characters depicted with the same hexadecimal variation as non-white characters?
  • Or, are women depicted with more or less hexadecimal variation than men?
  • Perhaps white characters are more likely to be depicted in more dramatic and dynamic lighting, causing their skin to be depicted with more variation than non-white characters.

If any of this is true, it might also make an interesting data-based argument to suggest that white characters are featured in more dynamic ways in comic books than are non-white characters. The same could be true of men compared with women.

Just to give this a try, I downloaded a free eye-dropper plug-in that identifies hexadecimal IDs. I used the top 16 images in a Google Image search for Batman (white man), Amazing-man (black man), and Wonder Woman (white woman). Because many images alter skin tone with shadows and light, I tried to use the eye-dropper to select the pixel that appeared most representative of the skin tone of the face of each character depicted.

Here are the images for Batman with a clean swatch of the hexadecimal IDs for the skin tone associated with each image below:

2 (1)

Below are the images for Amazing-man with swatches of the skin tone color codes beneath:

2

Finally, here are the images for Wonder Woman with pure samples of the color codes associated with her skin tone for each image below:

3

Now, perhaps it was unfair to use Batman as a comparison as his character is more often depicted at night than is Wonder Woman—a fact which might mean he is more often depicted in dynamic lighting than she is. But it’s an interesting thought experiment.  Based on this sample, two things that seem immediately apparent:

  • Amazing-man is depicted much darker when his character is drawn angry.
  • And Wonder Woman exhibits the least color variation of the three.

Whether this is representative is beyond the scope of the post.  But, it’s an interesting question.  While we know that there are dramatically fewer women in comic books than men, inequality is not only a matter of numbers.  Portrayal matters a great deal as well, and color codes might be one way of considering getting at this issue in a new and systematic way.

While the hexadecimal ID of an individual pixel of an image is an objective measure of color, it’s also true that color is in the eye of the beholder and we perceive colors differently when they are situated alongside different colors. So, obviously, color alone tells us little about individual perception, and even less about the social and cultural meaning systems tied to different hexadecimal hues. Yet, as Wimberly writes,

In art, this is very important. Art is where associations are made. Art is where we form the narratives of our identity.

Beyond this, art is a powerful cultural arena in which we form narratives about the identities of others.

At any rate, it’s an interesting idea. And I hope someone smarter than me does something with it (or tells me that it’s already been done and I simply wasn’t aware).

Originally posted at Feminist Reflections and Inequality by Interior Design. Cross-posted at Pacific Standard. H/t to Andrea Herrera.

Tristan Bridges is a sociologist of gender and sexuality at the College at Brockport (SUNY).  Dr. Bridges blogs about some of this research and more at Inequality by (Interior) Design.  You can follow him on twitter @tristanbphd.

We’ve highlighted the really interesting research coming out of the dating site OK Cupid before. It’s great stuff and worth exploring:

All of those posts offer neat lessons about research methods, too. And so does the video below of co-founder Christian Rudder talking about how they’ve collected and used the data. It might be fun to show in research methods classes because it raises some interesting questions like: What are different kinds of social science data? How can/should we manipulate respondents to get it? What does it look like? How can it be used to answer questions? Or, how can we understand the important difference between having the data and doing an interpretation of it? That is, the data-don’t-speak-for-themselves issue.

Lisa Wade, PhD is an Associate Professor at Tulane University. She is the author of American Hookup, a book about college sexual culture; a textbook about gender; and a forthcoming introductory text: Terrible Magnificent Sociology. You can follow her on Twitter and Instagram.

Thanks for the comic about meta-analyses, xkcd.

I’m not saying that the Patriots are out-and-out liars. But they are outliers.

The advantage of an underinflated ball, like the eleven of the twelve footballs the Patriots used last Sunday, is that it’s easier to grip. Ball carriers will be less likely fumble if they’re gripping a ball they can sink their fingers into.

We can’t go back and measure the pressure of balls the Patriots were using before the Colts game, but Warren Sharp (here) went back and dug up the data on fumbles for all NFL games since 2010.  Since a team that controls the ball and runs more plays has more chances to fumble, Sharp graphed the ratio of plays to fumbles (values in red squares in the chart below) along with the absolute number of fumbles (values in blue circles). The higher the ratio, the less fumble-prone the team was.

1

One of these things is not like the others.  That’s what an outlier is. It’s off the charts. It’s nowhere near the trend line. Something about it is very different. The variables that might explain the differences among the other data points – better players, better weather or a domed stadium, a pass-centered offense – don’t apply. Something else is going on.

As the graph shows, when the teams are rank ordered on the plays/fumbles ratio, the difference between one team and the next higher is usually 0-2, there are only two gaps of 5 until the 9-point gap between #3 Atlanta and #2 Houston. From the second-best Texans and to the Patriots there’s a 47-point jump.

Sharp also graphed the data as a histogram.

1 (4)

It’s pretty much a bell curve centered around the mean of 105 plays-per-fumble. Except for that outlier. And the chart shows just how far out it lies.

The Patriots play in a cold-weather climate in a stadium exposed to the elements.  Yet their plays/fumble ratio is 50% higher than that of the Packers, 80% higher than the Bears. They have good players, but those players fumble less often for the Patriots than they did when they played for other NFL teams.

Usually, the statistical anomaly comes first – someone notices that US healthcare costs are double those of other nations – and then people try to come up with explanations.  In this case, it wasn’t until we had a possible explanatory variable that researchers went back and found the outlier. As Peter Sagal of “Wait, Wait, Don’t Tell Me” said, “The League became suspicious when a Patriots player scored a touchdown and instead of spiking the ball he just folded it and put it in his pocket.”

UPDATE, Jan. 28: Since I posted this, there has been some discussion of Sharp’s data (“discussion” is a euphemism – this is sports and the Internet after all). If you’re really interested in pursuing this, try Advanced Football Analytics  or this piece  at Deadspin “Why Those Statistics About The Patriots’ Fumbles Are Mostly Junk,” (to repeat, “discussion” is a euphemism, and if you more strongly voiced views, read the comments). One of the difficulties I suspect is that a fumble is a rare event. The difference between the teams with the surest grip and the most butterfingered is about one fumble every couple of games.

Cross-posted at Montclair SocioBlog.

Jay Livingston is the chair of the Sociology Department at Montclair State University. You can follow him at Montclair SocioBlog or on Twitter.

Every year, at the first faculty meeting, representatives of the registrar tell us what percentage of the incoming class is [insert variable in which we are interested, such as American Indian, working class, international, etc].  They compare it to last year’s percentage.  This drives me crazy because they do so as if comparing the last two data points in a sequence is indicative of a trend. But to determine whether or not there is a trend, and therefore whether the increase or decrease in the percentage of [insert variable in which we are interested] significant relative to last year, depends on more than two data points!

xkcd does an excellent job of illustrating just how two data points can be utterly meaningless, even wildly fallacious.

Other great xkcd cartoons: attribution and the in group, on statistical significance, correlation or causation, and the minimal group paradigm.

Originally posted in 2009.

Lisa Wade, PhD is an Associate Professor at Tulane University. She is the author of American Hookup, a book about college sexual culture; a textbook about gender; and a forthcoming introductory text: Terrible Magnificent Sociology. You can follow her on Twitter and Instagram.