
I’m not saying that the Patriots are out-and-out liars. But they are outliers.
The advantage of an underinflated ball, like the eleven of the twelve footballs the Patriots used last Sunday, is that it’s easier to grip. Ball carriers will be less likely fumble if they’re gripping a ball they can sink their fingers into.
We can’t go back and measure the pressure of balls the Patriots were using before the Colts game, but Warren Sharp (here) went back and dug up the data on fumbles for all NFL games since 2010. Since a team that controls the ball and runs more plays has more chances to fumble, Sharp graphed the ratio of plays to fumbles (values in red squares in the chart below) along with the absolute number of fumbles (values in blue circles). The higher the ratio, the less fumble-prone the team was.
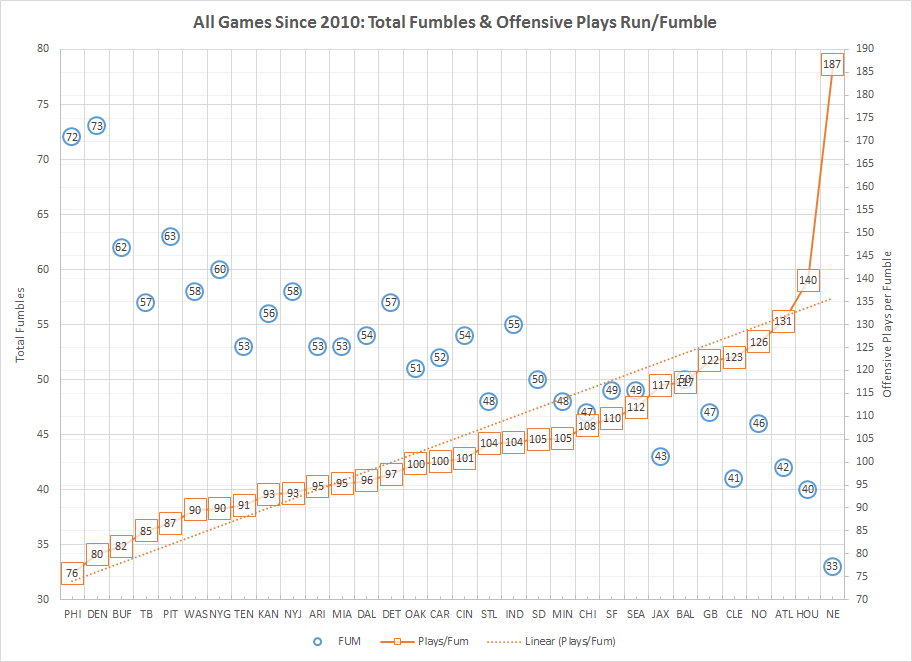
One of these things is not like the others. That’s what an outlier is. It’s off the charts. It’s nowhere near the trend line. Something about it is very different. The variables that might explain the differences among the other data points – better players, better weather or a domed stadium, a pass-centered offense – don’t apply. Something else is going on.
As the graph shows, when the teams are rank ordered on the plays/fumbles ratio, the difference between one team and the next higher is usually 0-2, there are only two gaps of 5 until the 9-point gap between #3 Atlanta and #2 Houston. From the second-best Texans and to the Patriots there’s a 47-point jump.
Sharp also graphed the data as a histogram.
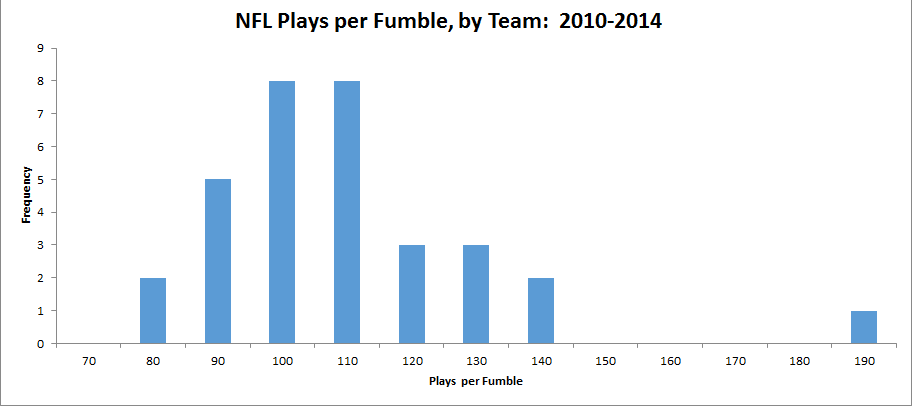
It’s pretty much a bell curve centered around the mean of 105 plays-per-fumble. Except for that outlier. And the chart shows just how far out it lies.
The Patriots play in a cold-weather climate in a stadium exposed to the elements. Yet their plays/fumble ratio is 50% higher than that of the Packers, 80% higher than the Bears. They have good players, but those players fumble less often for the Patriots than they did when they played for other NFL teams.
Usually, the statistical anomaly comes first – someone notices that US healthcare costs are double those of other nations – and then people try to come up with explanations. In this case, it wasn’t until we had a possible explanatory variable that researchers went back and found the outlier. As Peter Sagal of “Wait, Wait, Don’t Tell Me” said, “The League became suspicious when a Patriots player scored a touchdown and instead of spiking the ball he just folded it and put it in his pocket.”
UPDATE, Jan. 28: Since I posted this, there has been some discussion of Sharp’s data (“discussion” is a euphemism – this is sports and the Internet after all). If you’re really interested in pursuing this, try Advanced Football Analytics or this piece at Deadspin “Why Those Statistics About The Patriots’ Fumbles Are Mostly Junk,” (to repeat, “discussion” is a euphemism, and if you more strongly voiced views, read the comments). One of the difficulties I suspect is that a fumble is a rare event. The difference between the teams with the surest grip and the most butterfingered is about one fumble every couple of games.
Cross-posted at Montclair SocioBlog.
Jay Livingston is the chair of the Sociology Department at Montclair State University. You can follow him at Montclair SocioBlog or on Twitter.
Comments 10
Andy Whitten — January 28, 2015
The careful football scholar will also note this analysis: http://soshcentral.com/football-science/football-statistics/2015/01/27/fumbling-data-truth-patriots-fumble-rate/
As usual, the story is more complex than it first appears.
Sarah T. — January 28, 2015
Are they a true outlier, or was the data cherry-picked (intentionally or unintentionally) to make them look like an outlier? A lot of statisticians take issue with the analysis, including Drew Fustin http://drewfustin.com/2015/01/27/patriots-fumble-comments/
Dave — January 28, 2015
Other people have posted this, but there are some issues with the data used: http://regressing.deadspin.com/why-those-statistics-about-the-patriots-fumbles-are-mos-1681805710?utm_source=recirculation&utm_medium=recirculation&utm_campaign=wednesdayAM
Basically, if you just look at fumbles during runs or by receivers, the Pats are really, really good at not fumbling the football, but they are by no means outliers. Doesn't disprove the theory that deflated balls contribute to the Pats' success at not fumbling, but it certainly doesn't prove it, either.
Bill R — January 28, 2015
Why do we continue to hope that the NFL and NBA are really different in professionalism than the WWF? And why does anyone care?
If it weren't for the commercials it would only be overpriced entertainment. But it's worse than that; like the search engine business WE are the product.
Scott Grills — January 29, 2015
... hmmm.
Jehovah's Blitzness — January 29, 2015
How can the chair of a sociology department, with a PhD, not see the obvious problems with this "analysis" just from the scaling on those charts? Don't sociologists learn stats?
truthiness — January 29, 2015
Must be embarrassing to get snookered by an amateur hack statistician whose analysis would get torn apart in even a remedial statistics class. I almost feel sorry for Dr. Livingston.
The Patriots: Out-and-Out Liars? Or Just Outliers? - Treat Them Better — January 31, 2015
[…] The Patriots: Out-and-Out Liars? Or Just Outliers? […]
Nedwill — January 22, 2024
I see that passion for the Patriots has not subsided for many years now. My father is arguing with our neighbor about who is the best player of the season. I wanted to show them a list of the best players at melbet.mobi. But then I changed my mind)) It seems to me that this is one of the forms of the game for those who are fans.