methods/use of data

The short answer is, pretty well. But that’s not really the point.

In a previous post I complained about various ways of collapsing data before plotting it. Although this is useful at times, and inevitable to varying degrees, the main danger is the risk of inflating how strong an effect seems. So that’s the point about teen test scores and adult income.

If someone told you that the test scores people get in their late teens were highly correlated with their incomes later in life, you probably wouldn’t be surprised. If I said the correlation was .35, on a scale of 0 to 1, that would seem like a strong relationship. And it is. That’s what I got using the National Longitudinal Survey of Youth. I compared the Armed Forces Qualifying Test scores, taken in 1999, when the respondents were ages 15-19 with their household income in 2011, when they were 27-31.

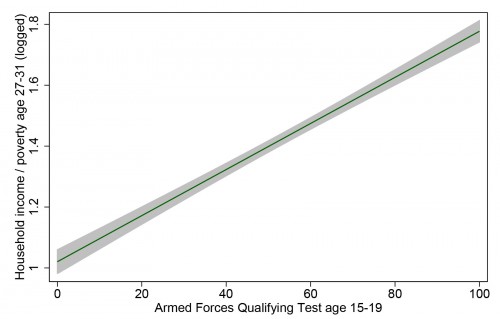
Here is the linear fit between between these two measures, with the 95% confidence interval shaded, showing just how confident we can be in this incredibly strong relationship:

1 (2) - Copy

That’s definitely enough for a screaming headline, “How your kids’ test scores tell you whether they will be rich or poor.” And it is a very strong relationship – that correlation of .35 means AFQT explains 12% of the variation in household income.

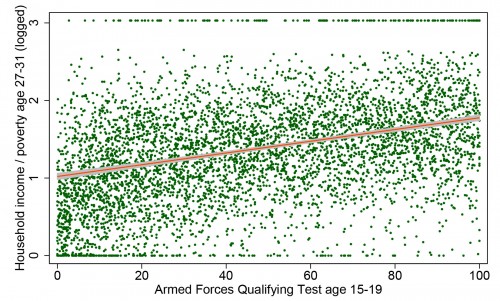
But take heart, ye parents in the age of uncertainty: 12% of the variation leaves a lot left over. This variable can’t account for how creative your children are, how sociable, how attractive, how driven, how entitled, how connected, or how White they may be. To get a sense of all the other things that matter, here is the same data, with the same regression line, but now with all 5,248 individual points plotted as well (which means we have to rescale the y-axis):

1 (2)

Each dot is a person’s life — or two aspects of it, anyway — with the virtually infinite sources of variability that make up the wonder of social existence. All of a sudden that strong relationship doesn’t feel like something you can bank on with any given individual. Yes, there are very few people from the bottom of the test-score distribution who are now in the richest households (those clipped by the survey’s topcode and pegged at 3 on my scale), and hardly anyone from the top of the test-score distribution who is now completely broke.

But I would guess that for most kids a better predictor of future income would be spending an hour interviewing their parents and high school teachers, or spending a day getting to know them as a teenager. But that’s just a guess (and that’s an inefficient way to capture large-scale patterns).

I’m not here to argue about how much various measures matter for future income, or whether there is such a thing as general intelligence, or how heritable it is (my opinion is that a test such as this, at this age, measures what people have learned much more than a disposition toward learning inherent at birth). I just want to give a visual example of how even a very strong relationship in social science usually represents a very messy reality.

Cross-posted at Family Inequality and Pacific Standard.

Philip N. Cohen is a professor of sociology at the University of Maryland, College Park, and writes the blog Family Inequality. You can follow him on Twitter or Facebook.

Here’s Matt Holliday. It’s strike three and it was three bad calls.

2

Holliday’s body language speaks clearly, and his reaction is understandable. The pitch was wide, even wider than the first two pitches, both of which the umpire miscalled as strikes.   Here’s the data:

1.jpg

The PITCHf/x technology that makes this graphic possible, whatever its value or threat to umpires, has been a boon for sabremetricians  and social scientists.  The big data provided can tell us not just the number of bad calls but the factors that make a bad call more or less likely.

In the New York Times, Brayden King and Jerry Kim report on their study of roughly 780,000 pitches in the 2008-09 season. Umpires erred on about 1 in every 7 pitches – 47,000 pitches over the plate that were called balls, and nearly 69,000 like those three to Matt Holliday.

Here are some of the other findings that King and Kim  report in today’s article.

  •  Umpires gave a slight edge to the home team pitchers, calling 13.3% of their pitches outside the zone as strikes.  Visitors got 12.6%.
  • The count mattered: At 0-0, the error rate was 14.7%, at 3-0, 18.6% of pitches outside the zone were called as strikes, and at 0-2, only 7.3% of pitches outside the zone were called as strikes.
  • All-star pitchers were more likely than others to get favorable calls…
  • …especially if the pitcher had a reputation as a location pitcher.
  • The importance of the situation (tie game, bottom of the ninth) made no difference in bad calls.

It seems that expectation accounts for a lot of these findings. It’s not that what you see is what you get. It’s that what you expect is what you see. We expect good All-star pitchers to throw more accurately.  We also expect that a pitcher who is way ahead in the count will throw a waste pitch and that on the 3-0, he’ll put it over the plate.  My guess is that umpires share these expectations. The difference is that the umps can turn their expectations into self-fulfilling prophecies.

Cross-posted at Business Insider.

Jay Livingston is the chair of the Sociology Department at Montclair State University. You can follow him at Montclair SocioBlog or on Twitter.

“How could we get evidence for this?” I often ask students. And the answer, almost always is, “Do a survey.” The word survey has magical power; anything designated by that name wears a cloak of infallibility.

“Survey just means asking a bunch of people a bunch of questions,” I’ll say. “Whether it has any value depends on how good the bunch of people is and how good the questions are.”  My hope is that a few examples of bad sampling and bad questions will demystify.

For example, Variety:

11

Here’s the lede:

Despite its Biblical inspiration, Paramount’s upcoming “Noah” may face some rough seas with religious audiences, according to a new survey by Faith Driven Consumers.

The data to confirm that idea:

The religious organization found in a survey that 98% of its supporters were not “satisfied” with Hollywood’s take on religious stories such as “Noah,” which focuses on Biblical figure Noah.

The sample:

Faith Driven Consumers surveyed its supporters over several days and based the results on a collected 5,000+ responses.

And (I’m saving the best till last) here’s the crucial survey question:

As a Faith Driven Consumer, are you satisfied with a Biblically themed movie — designed to appeal to you — which replaces the Bible’s core message with one created by Hollywood?

As if the part about “replacing the Bible’s core message” weren’t enough, the item reminds the respondent of her or his identity as a Faith Driven Consumer. It does make you wonder about that 2% who either were fine with the Hollywood* message or didn’t know.

You can’t really fault Faith Driven Consumer too much for this shoddy “research.” They’re not in business to find the sociological facts. What’s appalling is that Variety accepts it at face value and without comment.

Cross-posted at Montclair SocioBlog.

Jay Livingston is the chair of the Sociology Department at Montclair State University. You can follow him at Montclair SocioBlog or on Twitter.

Let’s imagine that a woman — we’ll call her “you,” like they do in relationship advice land — is trying to calculate the odds that a man will call back after sex. Everyone tells you that if you sleep with a guy on the first date he is less likely to call back. The theory is that giving sex away at a such a low “price” lowers the man’s opinion of you, because everyone thinks sluts are disgusting.* Also, shame on you.

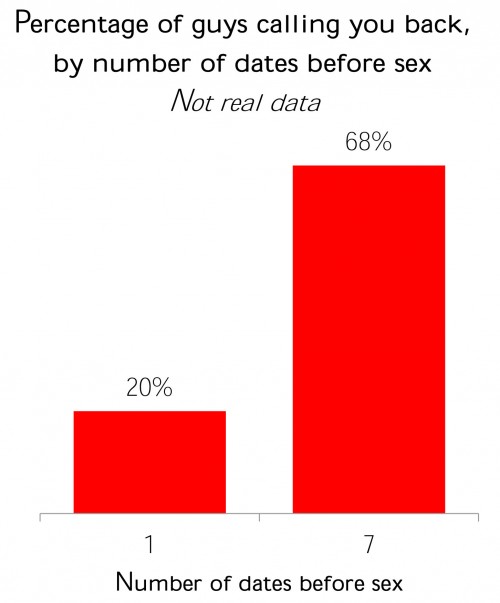
So, you ask, does the chance he will call back improve if you wait till more dates before having sex with him? You ask around and find that this is actually true: The times you or your friends waited till the seventh date, two-thirds of the guys called back, but when you slept with him on the first date, only one-in-five called back. From the data, it sure looks like sleeping with a guy on the first date reduces the odds he’ll call back.

1 (2)

So, does this mean that women make men disrespect them by having sex right away? If that’s true, then the historical trend toward sex earlier in relationships could be really bad for women, and maybe feminism really is ruining society.

Like all theories, this one assumes a lot. It assumes you (women) decide when couples will have sex, because it assumes men always want to, and it assumes men’s opinion of you is based on your sexual behavior. With these assumptions in place, the data appear to confirm the theory.

But what if that those assumptions aren’t true? What if couples just have more dates when they enjoy each other’s company, and men actually just call back when they like you? If this is the case, then what really determines whether the guy calls back is how well-matched the couple is, and how the relationship is going, which also determines how many dates you have.

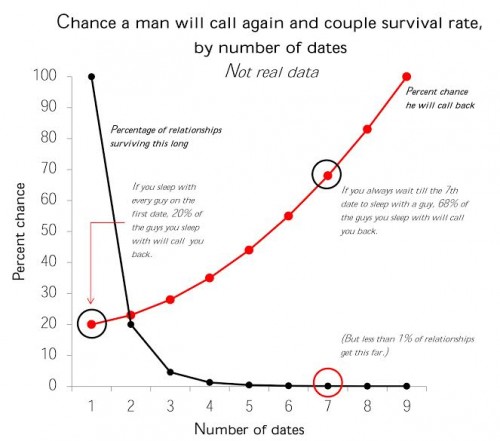
What was missing in the study design was relationship survival odds. Here is a closer look at the same data (not real data), with couple survival added:

5
(Graph corrected from an earlier version.)

.

By this interpretation, the decision about when to have sex is arbitrary and doesn’t affect anything. All that matters is how much the couple like and are attracted to each other, which determines how many dates they have, and whether the guy calls back. Every couple has a first date, but only a few make it to the seventh date. It appears that the first-date-sex couples usually don’t last because people don’t know each other very well on first dates and they have a high rate of failure regardless of sex. The seventh-date-sex couples, on the other hand, usually like each other more and they’re very likely to have more dates. And: there are many more first-date couples than seventh-date couples.

So the original study design was wrong. It should have compared call-back rates after first dates, not after first sex. But when you assume sex runs everything, you don’t design the study that way. And by “design the study” I mean “decide how to judge people.”

I have no idea why men call women back after dates. It is possible that when you have sex affects the curves in the figure, of course. (And I know even talking about relationships this way isn’t helping.) But even if sex doesn’t affect the curves, I would expect higher callback rates after more dates.

Anyway, if you want to go on blaming everything bad on women’s sexual behavior, you have a lot of company. I just thought I’d mention the possibility of a more benign explanation for the observed pattern that men are less likely to call back after sex if the sex takes place on the first date.

* This is not my theory.

Cross-posted at Family Inequality and Pacific Standard.

Philip N. Cohen is a professor of sociology at the University of Maryland, College Park, and writes the blog Family Inequality. You can follow him on Twitter or Facebook.
A survey question is only as good as its choices. Sometimes an important choice has been left off the menu.  I was Gallup polled once, long ago. I’ve always felt that they didn’t get my real opinion.

“What’d they ask?” said my brother when I mentioned it to him.

“You know, they asked whether I approved of the way the President was doing his job.”  Nixon – this was in 1969.
“What’d you say?”

“I said I disapproved of his entire existential being.”

I was exaggerating my opinion, and I didn’t actually say that to the pollster.  But even if I had, my opinion would have been coded as “disapprove.”

For many years the American National Election Study has asked:

How much of the time do you think you can trust the government in Washington to do what is right – just about always, most of the time or only some of the time?

The trouble with these choices at that they exclude the truly disaffected. The worst you can say about the federal government is that it can be trusted “only some of the time.”  A few ornery souls say they don’t trust the federal at all. But because that view is a write-in candidate, it usually gets only one or two percent of the vote.

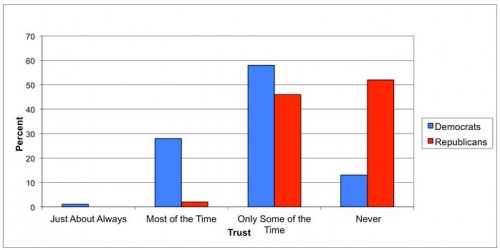
This year the study included “never” in the options read to respondents.  Putting “no-way, no-how” right there on the ballot makes a big difference. And as you’d expect, there were party differences:

1 (2)

Over half of Republicans say that the federal government can NEVER be trusted.

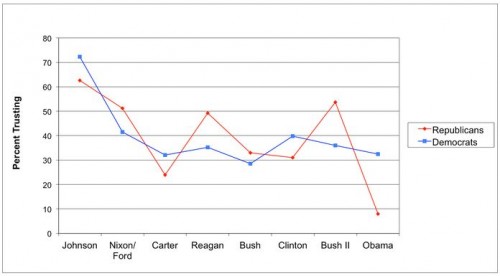
The graph appears in this Monkey Cage post by Marc Hetherington and Thomas Rudolph. Of course, some of those “never” Republicans don’t really mean “never ever.”  If a Republican becomes president, they’ll become more trusting, and the “never-trust” Democrat tide will rise.  Here’s the Hetherington-Rudolph graph tracking changes in the percent of people who do trust Washington during different administrations.

1 (3)

This one seems to show three things:

  1. Trust took a dive in the 1960s and 70s and never really recovered.
  2. Republican trust is much more volatile, with greater fluctuations depending on which party is in the White House.
  3. Republicans really, really hate President Obama.

Cross-posted at Montclair SocioBlog.

Jay Livingston is the chair of the Sociology Department at Montclair State University. You can follow him at Montclair SocioBlog or on Twitter.

Last week Kay Hymowitz (who sometimes works out of a PO Box rented by Brad Wilcox) wrote the following in the LA Times:

As far back as the 1970s, family researchers began noticing that… [b]oys from broken homes were more likely than their peers to get suspended and arrested… And justice experts have long known that juvenile facilities and adult jails overflow with sons from broken families. Liberals often assume that these kinds of social problems result from our stingy support system for single mothers and their children. But the link between criminality and fatherlessness holds even in countries with lavish social welfare systems.

Ah, the link between criminality and fatherlessness again. So ingrained is the assumption that crime rates always go up that conservatives making this argument do not even see the need to account for the incredible, world-historical drop in violence that has accompanied the collapse of the nuclear family. I know Kay Hymowitz knows this, because we’ve argued about it before. But if her editors and readers don’t, why should she make a big deal out of it?

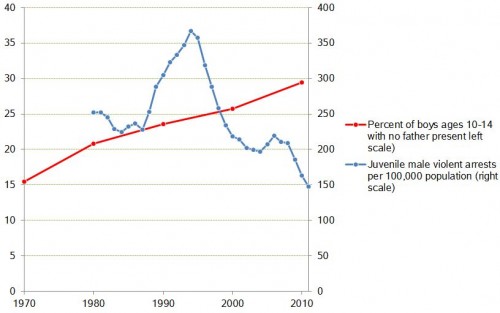
In this graph I show the scales down to zero so you can see the proportional change in each trend: father-not-present boys ages 10-14 and male juvenile violent-crime arrest rates.

1

I’m not arguing about whether boys living without fathers are more likely to commit crimes. I’m just saying that this is very unlikely to be the major cause of male juvenile violent crime if the trends can move so drastically in opposite directions at the same time. These aren’t little fluctuations. Even if you leave out the late-80s-early-90s spike in crime, arrests fell about 40% from 1980 to 2010 while father-absent boys increased almost 50%.

If you are going to argue for a strong association — which Hymowitz does — and use words like “tide,” you should at least acknowledge that the problem you are trumpeting is getting better while the cause you are bemoaning is getting worse.

Cross-posted at Family Inequality.

Philip N. Cohen is a professor of sociology at the University of Maryland, College Park, and writes the blog Family Inequality. You can follow him on Twitter or Facebook.

The Federal Reserve Bank has said it will maintain its stimulus policy as long as the economy remains weak. One of its key indicators for the strength of the economy is the unemployment rate, which has been steadily falling for several years, from 10% in October 2009 to 7.3% in August 2013.  However, this decline in the official unemployment rate gives a misleading picture of economic conditions, at least as far as the labor market is concerned.

The reason, as the Economy Policy Institute explains, is because of the large number of “missing workers.”  These missing workers are…

…potential workers who, because of weak job opportunities, are neither employed nor actively seeking a job. In other words, these are people who would be either working or looking for work if job opportunities were significantly stronger. Because jobless workers are only counted as unemployed if they are actively seeking work, these “missing workers” are not reflected in the unemployment rate.

We are seeing many more missing workers now than in recent history.  The chart below shows the Economic Policy Institute estimate for the number of missing workers.

missing workers_Page_1

 The next chart compares the estimated unemployment rate including missing workers (in orange) with the official unemployment rate (in blue).

unemployment rates_Page_1

As you can see, while the official unemployment rate continues to decline, the corrected unemployment rate remains stuck at a rate above 10%. In other words labor market conditions remain dismal. And here we are only talking about employment.  If we consider the quality of the jobs being created, things are even worse.

Martin Hart-Landsberg is a professor of economics at Lewis and Clark College. You can follow him at Reports from the Economic Front.

In survey questions, the result you get might depend on the choices you offer.

An article at The Atlantic explains “Why Americans All Believe They’re Middle Class.”  But is that what we all believe?  The author, Anat Shenker-Osorio, started with from these figure from a September 2012 Pew report.
1
Only 8-9% of Americans put themselves in the lower or upper class.  The other 91% say that they are “middle class,” some with a modifier (upper or lower), some without.  Shenker-Osorio continues:

Researching how people’s unconscious assumptions affect their perception of economic issues, I explored the linguistic dynamics behind the term “middle class,” especially in comparison to other economic groupings.

That would be fine, except that both she and Pew made one huge omission.  The Pew survey didn’t include “working class” as an option.  Out of sight, out of unconscious assumptions.

Language and Surveys

How big an omission is this?  Since 1972, the GSS has asked a similar question to tap “subjective social class” (i.e., what class people think they are regardless of their objective circumstances).  But the GSS includes “working” along with the upper, middle, and lower.

2

Like the Pew survey, the GSS finds less than 10% putting themselves in the upper or lower class.  But for the past forty years, the remaining nine-tenths of the population have been evenly split between “working” and “middle.”

Shenker-Osorio’s linguistic analysis runs into other data conflicts.  It’s not always easy to know what Americans mean by upper, lower, or middle class because:

Americans are relatively skittish about mentioning class. Contrasting databases of text from U.S. and UK sources, we find that Brits use “upper class” and “lower class” more readily; we prefer “wealthy” and “poor.”

But another database, the books in Google nGrams, shows something much different.

Contrasting Data

I constructed a ratio of American to British for the terms “upper class” and “lower class.”  A ratio of more than 100% means that the term appeared more frequently in American books.

Ratio for “upper class”:

3

Ratio for “lower class”:

4

In general, since 1900, US and UK books used these terms at about the same frequency.  But from 1955-1965, the US heard a crescendo in class talk.  By 1965, US books mentioned the “lower class” four times as often as did UK books.  Since then class talk in the US declined as rapidly as it had increased. (For some reason, Shenker-Osorio was unaware of my earlier post on these matters.)

The real US-UK difference is in “working class,” a term that Shenker-Osorio ignores. Since 1935, it has appeared less frequently in US books.  For the last 30 years, British books have mentioned the working class twice as often.

Ratio for “working class”:

5

It may be that the databases Shenker-Osorio used are better than nGrams, and it’s frustrating to find different sources of data pointing in different directions.  More important, we still don’t know what people mean when they say they are middle class.  Shenker-Osorio sees it as a category of exclusion.  The images we have of upper and lower are so extreme as to apply to almost nobody.

Not finding popular depictions of wealth and poverty similar to our own lived experiences, we determine we must be whatever’s left over.

True perhaps, but it tells only what people think middle class is not. I’m not familiar with the research on subjective social class, but it seems that we still don’t know what people think “middle class” actually is.  Nor do we know what they have in mind when they say they are working class.  I have my own hunches, but I will leave them for a later post.

Cross-posted at Montclair SocioBlog.

Jay Livingston is the chair of the Sociology Department at Montclair State University. You can follow him at Montclair SocioBlog or on Twitter.