methods/use of data

Everyone has been talking about last week’s Senate testimony from Christine Blasey Ford and Supreme Court nominee Brett Kavanaugh. Amid the social media chatter, I was struck by this infographic from an article at Vox:

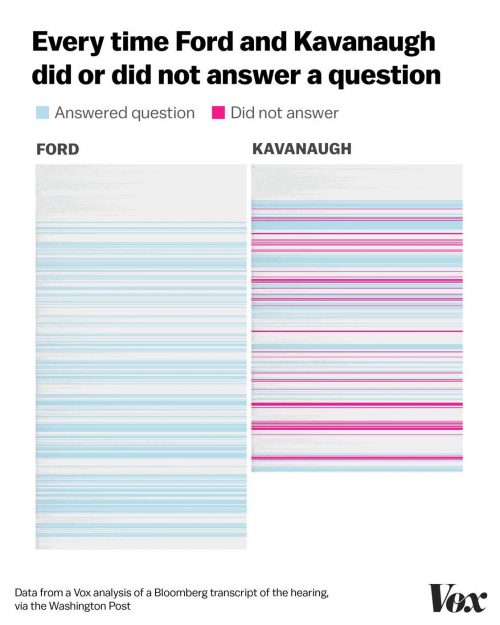
Commentators have noted the emotional contrast between Ford and Kavanaugh’s testimony and observed that Kavanaugh’s anger is a strategic move in a culture that is used to discouraging emotional expression from men and judging it harshly from women. Alongside the anger, this chart also shows us a gendered pattern in who gets to change the topic of conversation—or disregard it altogether.

Sociologists use conversation analysis to study how social forces shape our small, everyday interactions. One example is “uptalk,” a gendered pattern of pitched-up speech that conveys different meanings when men and women use it. Are men more likely to change the subject or ignore the topic of conversation? Two experimental conversation studies from American Sociological Review shed light on what could be happening here and show a way forward.

In a 1994 study that put men and women into different leadership roles, Cathryn Johnson found that participants’ status had a stronger effect on their speech patterns, while gender was more closely associated with nonverbal interactions. In a second study from 2001, Dina G. Okamoto and Lynn Smith-Lovin looked directly at changing the topic of conversation and did not find strong differences across the gender of participants. However, they did find an effect where men following male speakers were less likely to change the topic, concluding “men, as high-status actors, can more legitimately evaluate the contributions of others and, in particular, can more readily dismiss the contributions of women” (Pp. 867).

Photo Credit: Sharon Mollerus, Flickr CC

The important takeaway here is not that gender “doesn’t matter” in everyday conversation. It is that gender can have indirect influences on who carries social status into a conversation, and we can balance that influence by paying attention to who has the authority to speak and when. By consciously changing status dynamics —possibly by changing who is in the room or by calling out rule-breaking behavior—we can work to fix imbalances in who has to have the tough conversations.

Evan Stewart is an assistant professor of sociology at University of Massachusetts Boston. You can follow his work at his website, on Twitter, or on BlueSky.

This week Hurricane Florence is making landfall in the southeastern United States. Sociologists know that the impact of natural disasters isn’t equally distributed and often follows other patterns of inequality. Some people cannot flee, and those who do often don’t go very far from their homes in the evacuation area, but moving back after a storm hits is often a multi-step process while people wait out repairs.

We often hear that climate change is making these problems worse, but it can be hard for people to grasp the size of the threat. When we study social change, it is useful to think about alternatives to the world that is—to view a different future and ask what social forces can make that future possible. Simulation studies are especially helpful for this, because they can give us a glimpse of how things may turn out under different conditions and make that thinking a little easier.

This is why I was struck by a map created by researchers in the Climate Extremes Modeling Group at Stony Brook University. In their report, the first of its kind, Kevin Reed, Alyssa Stansfield, Michael Wehner, and Colin Zarzycki mapped the forecast for Hurricane Florence and placed it side-by-side with a second forecast that adjusted air temperature, specific humidity, and sea surface temperature to conditions without the effects of human induced climate change. It’s still a hurricane, but the difference in the size and severity is striking:

Reports like this are an important reminder that the effects of climate change are here, not off in the future. It is also interesting to think about how reports like these could change the way we talk about all kinds of social issues. Sociologists know that narratives are powerful tools that can change minds, and projects like this show us where simulation can make for more powerful storytelling for advocacy and social change.

Evan Stewart is an assistant professor of sociology at University of Massachusetts Boston. You can follow his work at his website, on Twitter, or on BlueSky.

Want to help fight fake news and manage political panics? We have to learn to talk about numbers.

While teaching basic statistics to sociology undergraduates, one of the biggest trends I noticed was students who thought they hated math experiencing a brain shutdown when it was time to interpret their results. I felt the same way when I started in this field, and so I am a big advocate for working hard to bridge the gap between numeracy and literacy. You don’t have to be a statistical wizard to make your reporting clear to readers.

Sociology is a great field to do this, because we are used to going out into the world and finding all kinds of cultural tropes (like pointlessly gendered products!). My new favorite trope is the Half-Dozen Headline. You can spot them in the wild, or through Google News with a search for “half dozen.” Every time I read one of these headlines, my brain echoes with “half of a dozen is six.”

Sometimes, six is a lot:

Sometimes, six is not:

(at least, not relative to past administrations)

Sometimes, well, we just don’t know:

Is this five deaths (nearly six)? Is a rate of about two deaths a year in a Walmart parking lot high? If people already struggle to interpret raw numbers, wrapping your findings in fuzzy language only makes the problem worse.

Spotting Half-Dozen Headlines is a great introductory exercise for classes in social statistics, public policy, journalism, or other fields that use applied data analysis. If you find a favorite Half-Dozen Headline, be sure to send it our way!

Evan Stewart is an assistant professor of sociology at University of Massachusetts Boston. You can follow his work at his website, on Twitter, or on BlueSky.

The Star Tribune recently ran an article about a new study from George Washington University tracking cases of Americans who traveled to join jihadist groups in Syria and Iraq since 2011. The print version of the article was accompanied by a graph showing that Minnesota has the highest rate of cases in the study. TSP editor Chris Uggen tweeted the graph, noting that this rate represented a whopping seven cases in the last six years.

Here is the original data from the study next to the graph that the paper published:

(Click to Enlarge)

Social scientists often focus on rates when reporting events, because it make cases easier to compare. If one county has 300 cases of the flu, and another has 30,000, you wouldn’t panic about an epidemic in the second county if it had a city with many more people. But relying on rates to describe extremely rare cases can be misleading. 

For example, the data show this graph misses some key information. California and Texas had more individual cases than Minnesota, but their large populations hide this difference in the rates. Sorting by rates here makes Minnesota look a lot worse than other states, while the number of cases is not dramatically different. 

As far as I can tell, this chart only appeared in the print newspaper photographed above and not on the online story. If so, this chart only went to print audiences. Today we hear a lot of concern about the impact of “filter bubbles,” especially online, and the spread of misleading information. What concerns me most about this graph is how it shows the potential impact of offline filter bubbles in local communities, too.

Evan Stewart is an assistant professor of sociology at University of Massachusetts Boston. You can follow his work at his website, on Twitter, or on BlueSky.

That large (and largely trademarked) sporting event is this weekend. In honor of its reputation for massive advertising, Lisa Wade tipped me off about this interesting content analysis of last year’s event by the Media Education Foundation.

MEF watched last year’s big game and tallied just how much time was devoted to playing and how much was devoted to ads and other branded content during the game. According to their data, the ball was only in play “for a mere 18 minutes and 43 seconds, or roughly 8% of the entire broadcast.”

MEF used a pie chart to illustrate their findings, but readers can get better information from comparing different heights instead of different angles. Using their data, I quickly made this chart to more easily compare branded and non-branded content.

Data Source: Media Education Foundation, 2018

One surprising thing that jumps out of this data is that, for all the hubbub about commercials, far and away the most time is devoted to replays, shots of the crowd, and shots of the field without the ball in play. We know “the big game” is a big sell, but it is interesting to see how the thing it sells the most is the spectacle of the event itself.

Evan Stewart is an assistant professor of sociology at University of Massachusetts Boston. You can follow his work at his website, on Twitter, or on BlueSky.

Based on analyses of General Social Survey data, a well-designed and respected source of data about American life, members of the Millennial generation are acquiring about the same number of sexual partners as the Baby Boomers. This data suggests that the big generational leap was between the Boomers and the generation before them, not the Boomers and everyone that came after. And rising behavioral permissiveness definitely didn’t start with the Millennials. Sexually speaking, Millennials look a lot like their parents at the same age and are perhaps even less sexually active then Generation X.

Is it true?

It doesn’t seem like it should be true. In terms of attitudes, American society is much more sexually permissive than it was for Boomers, and Millennials are especially more permissive. Boomers had to personally take America through the sexual revolution at a time when sexual permissiveness was still radical, while Generation X had to contend with a previously unknown fatal sexually transmitted pandemic. In comparison, the Millennials have it so easy. Why aren’t they having sex with more people?

A new study using data from the National Survey of Family Growth (NSFG) (hat tip Paula England) contrasts with previous studies and reports an increase. It finds that nine out of ten Millennial women had non-marital sex by the time they were 25 years old, compared to eight out of ten Baby Boomers. And, among those, Millennials reported two additional total sexual partners (6.5 vs. 4.6).

Nonmarital Sex by Age 25, Paul Hemez

Are Millennials acquiring more sexual partners after all?

I’m not sure. The NSFG report used “early” Millennials (only ones born between 1981 and 1990). In a not-yet-released book, the psychologist Jean Twenge uses another survey — the Youth Risk Behavior Surveillance System — to argue that the next generation (born between 1995 and 2002), which she calls the “iGen,” are even less likely to be sexually active than Millennial. According to her analysis, 37% of 9th graders in 1995 (born in 1981, arguably the first Millennial year) had lost their virginity, compared to 34% in 2005, and 24% in 2015.

Percentage of high school students who have ever had sex, by grade. Youth Risk Behavior Surveillance System, 1991-2015.

iGen, Jean Twenge

If Twenge is right, then we’re seeing a decline in the rate of sexual initiation and possibly partner acquisition that starts somewhere near the transition between Gen X and Millennial, proceeds apace throughout the Millennial years, and is continuing — Twenge argues accelerating — among the iGens. So, if the new NSFG report finds an increase in sexual partners between the Millennials and the Boomers, it might be because they sampled on “early” Millennials, those closer to Gen Xers, on the top side of the decline.

Honestly, I don’t know. It’s interesting though. And it’s curious why the big changes in sexually permissive attitudes haven’t translated into equally sexually permissive behaviors. Or, have actually accompanied a decrease in sexual behavior. It depends a lot on how you chop up the data, too. Generations, after all, all artificial categories. And variables like “nonmarital sex by age 25” are specific and may get us different findings than other measures. Sociological questions have lots of moving parts and it looks as if we’re still figuring this one out.

Lisa Wade, PhD is an Associate Professor at Tulane University. She is the author of American Hookup, a book about college sexual culture; a textbook about gender; and a forthcoming introductory text: Terrible Magnificent Sociology. You can follow her on Twitter and Instagram.

Originally posted at Scatterplot.

There are few things more satisfying than finding another reason that millennials are the worst. They’re narcissistic, coddled, unpatriotic, racist, and nervous about free speech. And now, millennial men want a return to the nostalgic 1950s, with women in the kitchen, whipping up a nice quiche after a hard day on the line.

This is the story presented in Stephanie Coontz’s Friday piece in the New York Times, “Do Millennial Men Want Stay-at-Home Wives,”which reports on evidence from the Council on Contemporary Families (using the General Social Survey) and from sociologists Joanna Pepin and David Cotter (using Monitoring the Future ).

Journalists have gone a bit nuts for this millennial-as-Ward-Cleaver narrative, consistent with what we already know about garbage millennials, and stories from Quartz and Time Magazine have already popped up.

The Times piece includes this damning trend among men ages 18-25:

Picture1.png
See? Millennial men are the WORST.


But the GSS just released their 2016 data this week. 89% of men disagree or strongly disagree with the statement “It is much better for everyone involved if the man is the achiever outside the home and the women takes care of the home and family” – the highest rate among either men or women ages 18-25 in the GSS’s 40-year history. It’s also much higher than the rate reported by everyone older than 25, about 71%.

So is the story, “Clinton defeat inspires millennial men to gender equality”? Or more likely, “Garbage millennial men can’t make up their mind about women”?

I suspect it’s another, less sexy story: you can’t say a lot about millennials based on talking to 66 men.

The GSS surveys are pretty small – about 2,000-3,000 per wave – so once you split by sample, and then split by age, and then exclude the older millennials (age 26-34) who don’t show any negative trend in gender equality, you’re left with cells of about 60-100 men ages 18-25 per wave. Standard errors on any given year are 6-8 percent.

So let’s throw some statistics at it. Suppose you want to know whether there is a downward trend in young male disagreement with the women-in-the-kitchen statement. Using all available GSS data, there is a positive, not statistically significant trend in men’s attitudes (more disagreement). Starting in 1988 only, there is very, very small negative, not statistically significant effect.

Only if we pick 1994 as a starting point, as Coontz does, ignoring the dip just a few years prior, do we see a negative less-than half-percentage point drop in disagreement per year, significant at the 10-percent level.

As Columbia statistician Andrew Gelman wisely warns, none of these results account for the many, many paths the researchers could have taken to arrive at these results, which can make overreliance on any of these p-values problematic. For example, if we just looked at millennials the way they’re usually defined, as individuals ages 18-34?

The Pepin and Cotter piece, in fact, presents two additional figures in direct contrast with the garbage millennial theory – in Monitoring the Future, millennial men’s support for women in the public sphere has plateaued, not fallen; and attitudes about women working have continued to improve, not worsen. Their conclusion is, therefore, that they find some evidence of a move away from gender equality – a nuance that’s since been lost in the discussion of their work.

So what does this mean? Standard errors matter, and millennials might not always be as garbage as we think they are.

Emily Beam is Assistant Professor of Economics at the University of Vermont. She studies labor and development economics, with a particular focus on employment and education policy, migration, fertility and marriage, and the role of incomplete information and behavioral biases on individual decision-making.

Flashback Friday.

Add to the list of new books to read Delusions of Gender: How Our Minds, Society, and Neurosexism Create Difference, by Cordelia Fine. Feeding my interest in the issue of sexual dimorphism in humans — which we work so hard to teach to children — the book is described like this:

Drawing on the latest research in neuroscience and psychology, Cordelia Fine debunks the myth of hardwired differences between men’s and women’s brains, unraveling the evidence behind such claims as men’s brains aren’t wired for empathy and women’s brains aren’t made to fix cars.

Good reviews here and here report that Fine tackles an often-cited study of newborn infants’ sex difference in preferences for staring at things, by Jennifer Connellan and colleagues in 2000. They reported:

…we have demonstrated that at 1 day old, human neonates demonstrate sexual dimorphism in both social and mechanical perception. Male infants show a stronger interest in mechanical objects, while female infants show a stronger interest in the face.

And this led to the conclusion: “The results of this research clearly demonstrate that sex differences are in part biological in origin.” They reached this conclusion by alternately placing Connellan herself or a dangling mobile in front of tiny babies, and timing how long they stared. There is a very nice summary of problems with the study here, which seriously undermine its conclusion.

However, even if the methods were good, this is a powerful example of how a tendency toward difference between males and females is turned into a categorical opposition between the sexes — as in, the “real differences between boys and girls.”

To illustrate this, here’s a graphic look at the results in the article, which were reported in this table:

They didn’t report the whole distribution of boys’ and girls’ gaze-times, but it’s obvious that there is a huge overlap in the distributions, despite a difference in the means. In the mobile-gaze-time, for example, the difference in averages is 9.7 seconds, while the standard deviations are more than 20 seconds. If I turn to my handy normal curve spreadsheet template, and fit it with these numbers, you can see what the pattern might look like (I truncate these at 0 seconds and 70 seconds, as they did in the study):

Source: My simulation assuming normal distributions from the data in the table above.

All I’m trying to say is that the sexes aren’t opposites, even if they have some differences that precede socialization.

If you could show me that the 1-day-olds who stare at the mobiles for 52 seconds are more likely to be engineers when they grow up than the ones who stare at them for 41 seconds (regardless of their gender) then I would be impressed. But absent that, if you just want to use such amorphous differences at birth to explain actual segregation among real adults, then I would not be impressed.

Originally posted in September, 2010.

Philip N. Cohen is a professor of sociology at the University of Maryland, College Park. He writes the blog Family Inequality and is the author of The Family: Diversity, Inequality, and Social Change. You can follow him on Twitter or Facebook.