Fish farming, the raising of fish in captivity, is often seen as a more sustainable way to feed the increasingly global hunger for seafood.  At least, the story goes, it doesn’t contribute to the over-fishing of our oceans.

Right?

The answer turns out to be: not necessarily.  Carnivorous species of farmed fish still need to be fed, so there is  an entire secondary industry: fishing for fish food.  Just about anything that can be caught will do; the mix of sea animals is simply ground up and made into pellets.  So, the fisherman typically catch absolutely everything that they can, sterilizing a small piece of the ocean.  They don’t distinguish between large and small fish (the large they can sell as human food, the small they sell as fish food) or adults and juveniles. By taking the larger fish, they’re taking out populations before they have a chance to reproduce.  You can see how this is a system with a devastating expiration date.

This 9-minute clip from Grinding Nemo covers the environmental impact of this practice, as well as the inhumane working conditions of some of the men hired to work in this industry:

Via Sociology in Focus.

Lisa Wade, PhD is an Associate Professor at Tulane University. She is the author of American Hookup, a book about college sexual culture; a textbook about gender; and a forthcoming introductory text: Terrible Magnificent Sociology. You can follow her on Twitter and Instagram.

JUST THE HIGHLIGHTS!

ALL OUR COVERAGE OF THE 2012 U.S. PRESIDENTIAL ELECTION

History:

Culture and Psychology:

Systems:

Religion:

Media:

Money:

Race:

Class:

Sexual Orientation:

Gender:

After the Election:

Lisa Wade, PhD is an Associate Professor at Tulane University. She is the author of American Hookup, a book about college sexual culture; a textbook about gender; and a forthcoming introductory text: Terrible Magnificent Sociology. You can follow her on Twitter and Instagram.

Today’s the big day: it’s Election Day in the U.S. This is the day we all go out and select our president.

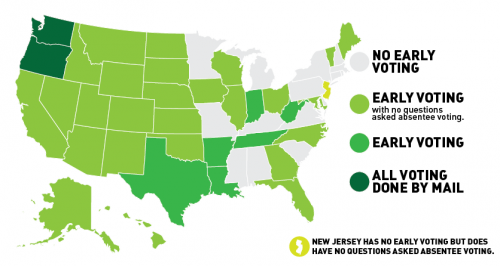
Sort of. The first Tuesday in November is set as the official day to go to the polls. But many states now allow early voting and/or place few restrictions on absentee voting. ThinkProgress created a map illustrating the availability of early voting:

In Nevada, early voting began October 20th. All registered voters receive a schedule of early voting locations; some are open every day, while additional locations open on weekends.

I voted at a grocery store on the afternoon of the 20th. I was surprised there was a line. A poll worker said they expected more than a thousand people would vote in that location on that day alone, up from about 800 the first day of voting in 2008.

The appeal of early voting is pretty obvious: more time to do it, a greater likelihood that you can vote without having to take off of work, spreading voting out over time means shorter lines and less waiting to cast your vote, convenient locations, and also when a pollster calls and you tell them you already voted, sometimes you get to skip a lot of their questions.

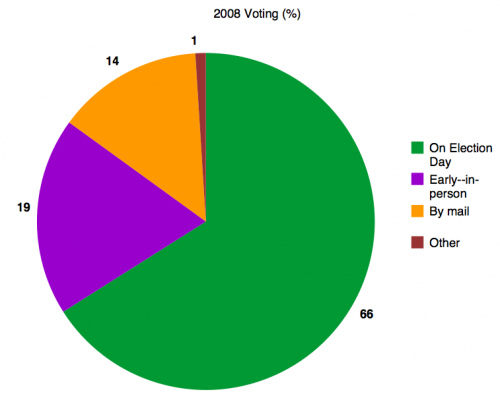
So how many people take advantage of early voting? The Pew Research Center released some data about the 2008 election. A third of voters said they voted early, either in person or by mail:

That’s a third of all voters — but a number of states, especially on the East Coast, don’t offer early voting. In the South, 42% of voters had cast their ballots before Election Day, according to the full report.

Early voting is expected to be more common this year than in 2008. For instance, 56% of all registered voters in Nevada, one of the coveted swing states, went to the polls before early voting ended on Saturday. That will likely be 65-70% of the total turnout.

Voters’ behavior indicates a clear preference for early voting. It can address at least some of the reasons given by those who are registered but do not vote as obstacles to their participation, especially if voting by mail is an option.

We still focus on Election Day as the day, because it’s the end of the election cycle and, for many voters, still their only option for voting (and we may see a shift back in this direction, as states like Florida have restricted early voting). But in some of the all-important swing states that make or break a candidate’s bid for the presidency, the outcome of the election has already been decided; Election Day just determines the margin of victory.

Gwen Sharp is an associate professor of sociology at Nevada State College. You can follow her on Twitter at @gwensharpnv.

Last week I posted about voter turnout patterns. In 2008, about 64% of eligible citizens voted. So what reasons do non-voters give for not taking part in the election? The Census Bureau asked. I created a chart of the data found on p. 14 of the report by Thom File and Sarah Crissey.

UPDATE: Please note this data is for registered non-voters; about 89% of this group votes, significantly higher than that for eligible citizens overall. I apologize that I didn’t make the distinction clearer in my initial post.

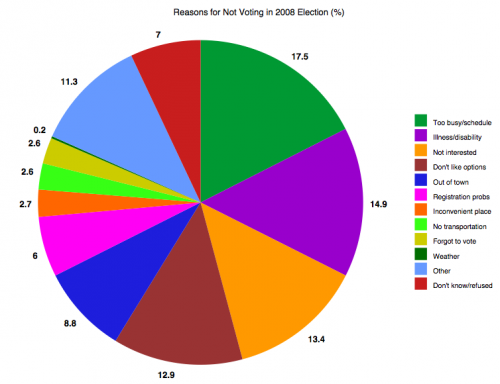
Here are the reasons registered non-voters gave:

So the single most common reason (17.5%) for not voting was that the person was too busy or their schedule conflicted with available voting hours (at least those the respondent was aware of). Other common reasons were illness or disability (14.9%), the person just wasn’t interested in the election (13.4%), didn’t like the candidates or issues (12.9%), and other (11.3%).

Many of these barriers to voting could likely be addressed by the same basic changes: expanding voting options. Scheduling conflicts, being too busy or out of town, lack of transportation, and problems caused by illness or disability might all be ameliorated by expanded early voting and/or making it easy to vote by mail.

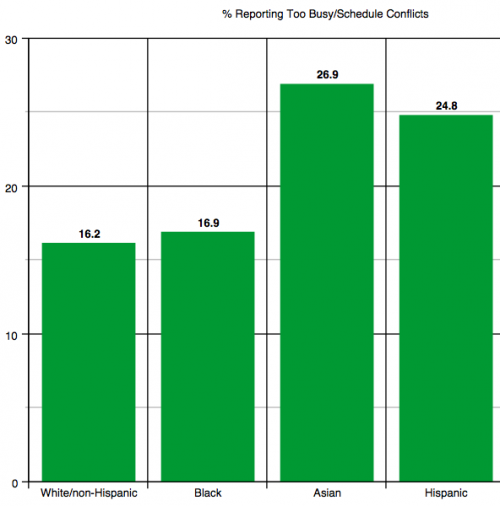
These issues were not equally problematic for all racial/ethnic groups. For instance, Asian-Americans and Hispanics (of any race) were more likely to report being too busy or that voting conflicted with their schedule than were White non-Hispanics or African Americans:

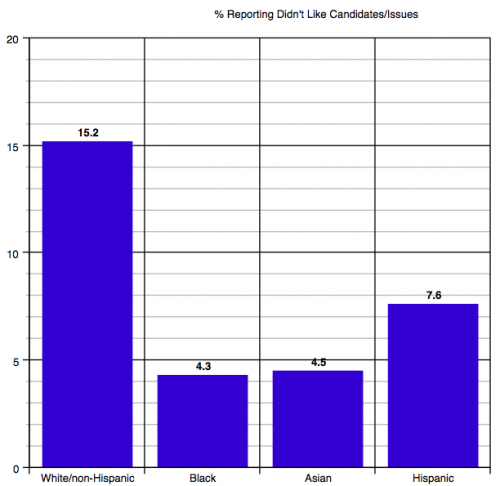
White non-Hispanics were more likely than other groups to say they didn’t vote because they didn’t like the candidates or issues:

The report also breaks responses down by age and education, so check out p. 14 if you’re interested in the patterns based on those demographics. It also includes data on why people don’t register, either — the most common being lack of interest or involvement in politics.

Gwen Sharp is an associate professor of sociology at Nevada State College. You can follow her on Twitter at @gwensharpnv.

Over at his blog, Made in America, Claude Fischer discusses data showing that the percentage of (White) Americans who say that they will vote for a qualified Black president has been rising since the 1950s. Today it sits at about 96%.

Fischer rightly observes that it’s difficult to know exactly what to make of this information. The trend likely reflects a combination of a real decrease in prejudice and a rising appreciation for the fact that it’s unpopular to admit that you wouldn’t vote for a Black person, even on a survey.

Still, assuming for the moment that it represents real attitudinal change, Fischer asks, is “the glass 96 percent full or is it 4 percent empty?”  Given our two-party partisan political system, elections are frequently decided by margins this narrow.  Obama won with just 53% of the popular vote in 2008.  Political scientists estimate that there was a 5 point racial penalty (that is, if he had been White, he would likely have won 58% of the vote).

Tomorrow is election day and it’s difficult to know if race will play more or less of a role than it did in the last election.  On the one hand, most people who were worried that Obama would be a racially radical President now know that he is not (some people will never be convinced) and others may have become more used to seeing an African American face in the White House.  On the other hand, racial progress usually incites a backlash.  That face in such a venerated position of power may have aggravated people who are now actively racist instead of complacently so.

Finally, as Fischer observes, we have absolutely no data on the penalty Romney will pay for being Mormon.

Happy election day eve, America. May we all end tomorrow with a strong beverage of consolation or celebration.

Lisa Wade, PhD is an Associate Professor at Tulane University. She is the author of American Hookup, a book about college sexual culture; a textbook about gender; and a forthcoming introductory text: Terrible Magnificent Sociology. You can follow her on Twitter and Instagram.

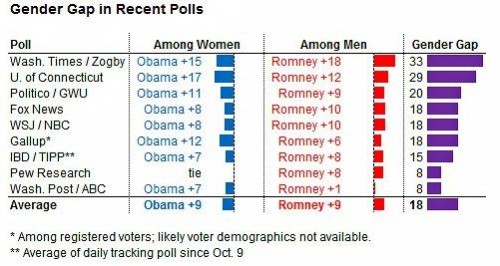
Nate Silver, the statistics guru behind FiveThirtyEight, is predicting that the gender gap in tomorrow’s election will be “near historic highs.”   According to Silver’s averaging of recent poll data, Obama has a 9-point lead among women, Romney has the same size lead among men.

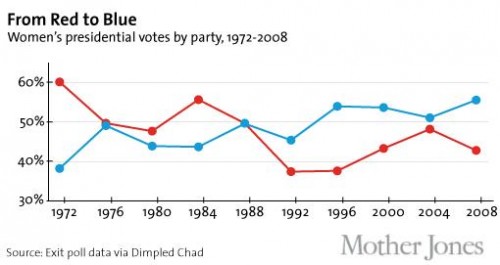
Women haven’t always leaned Democratic.  The trend started in the 1990s, as data at Mother Jones reveals:

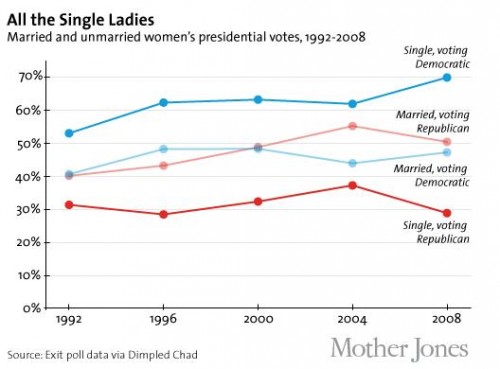
Single women are especially likely to vote Democratic.  Seventy percent voted for Obama in 2008:

A concern for reproductive rights, especially in light of recent Republican comments, are likely a big driver of women’s retreat from the political right.  Their concerns very well may swing the election.  In a poll of swing states, Gallup found that abortion topped the list of concerns for women; it didn’t make men’s top five:

It will be interesting to see how long the Republicans will hold onto positions unfriendly to women’s reproductive options.

Lisa Wade, PhD is an Associate Professor at Tulane University. She is the author of American Hookup, a book about college sexual culture; a textbook about gender; and a forthcoming introductory text: Terrible Magnificent Sociology. You can follow her on Twitter and Instagram.

For whatever reason, there has been a real slump in the number of people typing “obama gun” (will he take our guns away?), “obama muslim” (the idea used to run at about 20%), “obama socialist” (the republic “hangs in the balance“), and “obama citizen” (thank you, Snopes) into the Google search box since the 2008 election.

Here’s the Google trend (and the search link):

We don’t know how much these fears, versus other concerns, will affect votes against him this year, although there have been some good efforts to track the effects of anti-Black racism on his vote tally.

Naturally, not everyone who Googles these things believes the underlying stories or myths. But it seems likely they either believe them, are considering them, heard someone repeat them, or are arguing with someone who believes them, etc. So I’m guessing – just guessing – that these trends track those beliefs.

But maybe four years of Obama as an actual president has softened up the hard-line hatred in some quarters. What do you think?

Philip N. Cohen is a professor of sociology at the University of Maryland, College Park, and writes the blog Family Inequality. You can follow him on Twitter or Facebook.

A BBC poll of almost 22,000 people in 21 countries found that, on average, they preferred Obama to Romney more than five to one.  Only one country, Pakistan, would elect Romney.

Results ranked by support for Obama:

Results ranked by support for Romney:

What does it mean that this is such a close race here?

Via The Grumpy Sociologist.

Lisa Wade, PhD is an Associate Professor at Tulane University. She is the author of American Hookup, a book about college sexual culture; a textbook about gender; and a forthcoming introductory text: Terrible Magnificent Sociology. You can follow her on Twitter and Instagram.