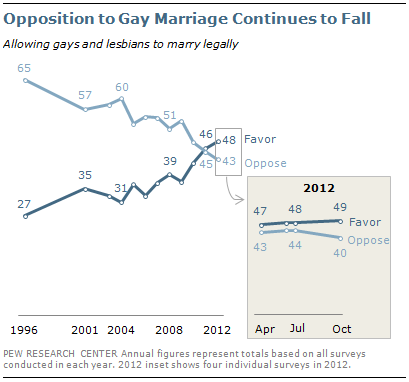
Last week, on the heels of Obama’s announcement that he supports gay marriage, NPR interviewed the President of the Pew Research Center, Andrew Kohut, about trends in American support for the issue. Kohut explained that American opinion has changed dramatically, and unusually, in a very short time. In 1996, for example, 27% of people supported gay marriage (65% opposed). This “really didn’t change very much” for a while. In 2004, when Republicans mobilized the issue to get conservatives to the polls, 60% still opposed it. But today, in the space of less than a decade, we have more people supporting gay marriage than opposing it. Some polls show the majority of Americans believe that we should have the right to marry someone of the same sex.
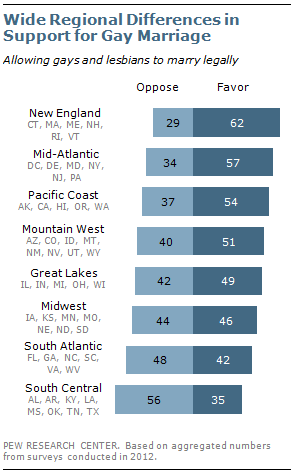
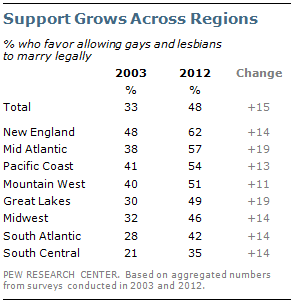
This trend is driven, in part, by young people replacing the old, but focusing on this overshadows the fact that essentially all Americans — of every stripe — show higher support for gay marriage than they did a decade ago. Both men and women and people of all races, political affiliations, religions, and ages are showing increased support for gay marriage. This is a real, remarkable, and rare shift in opinion:
Opinion by age: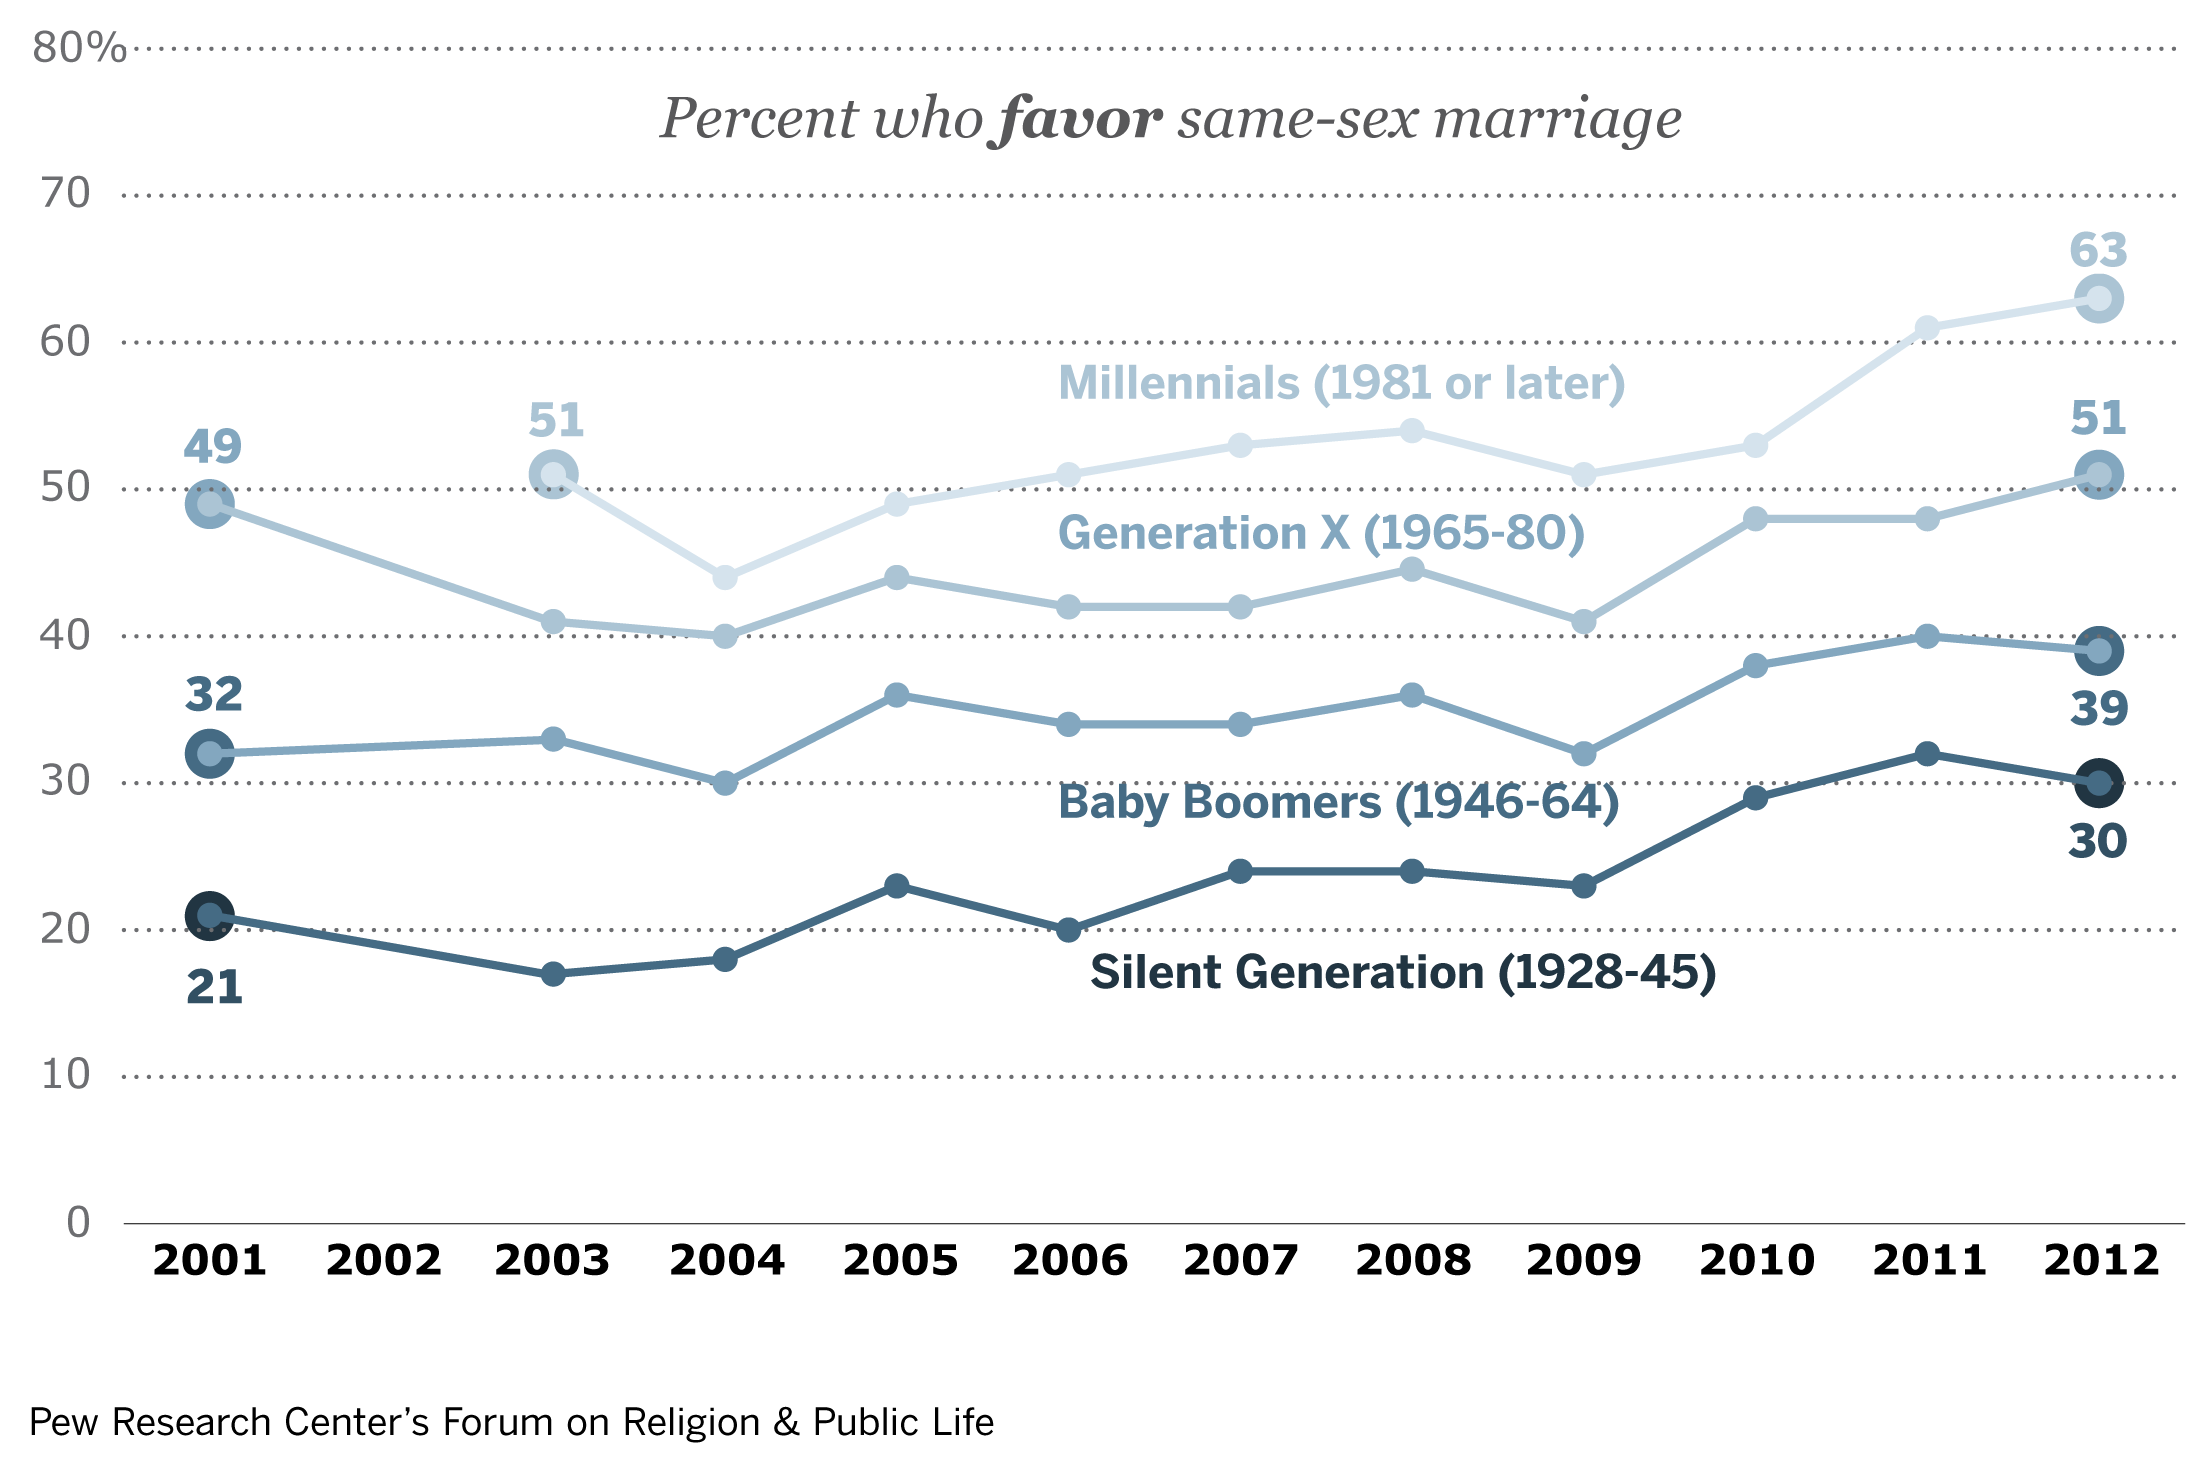
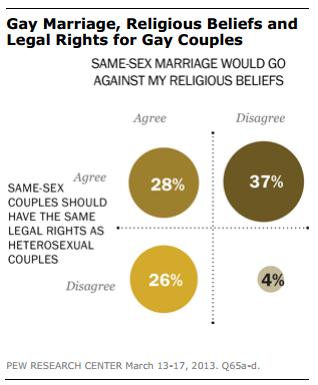
Opinion by religion: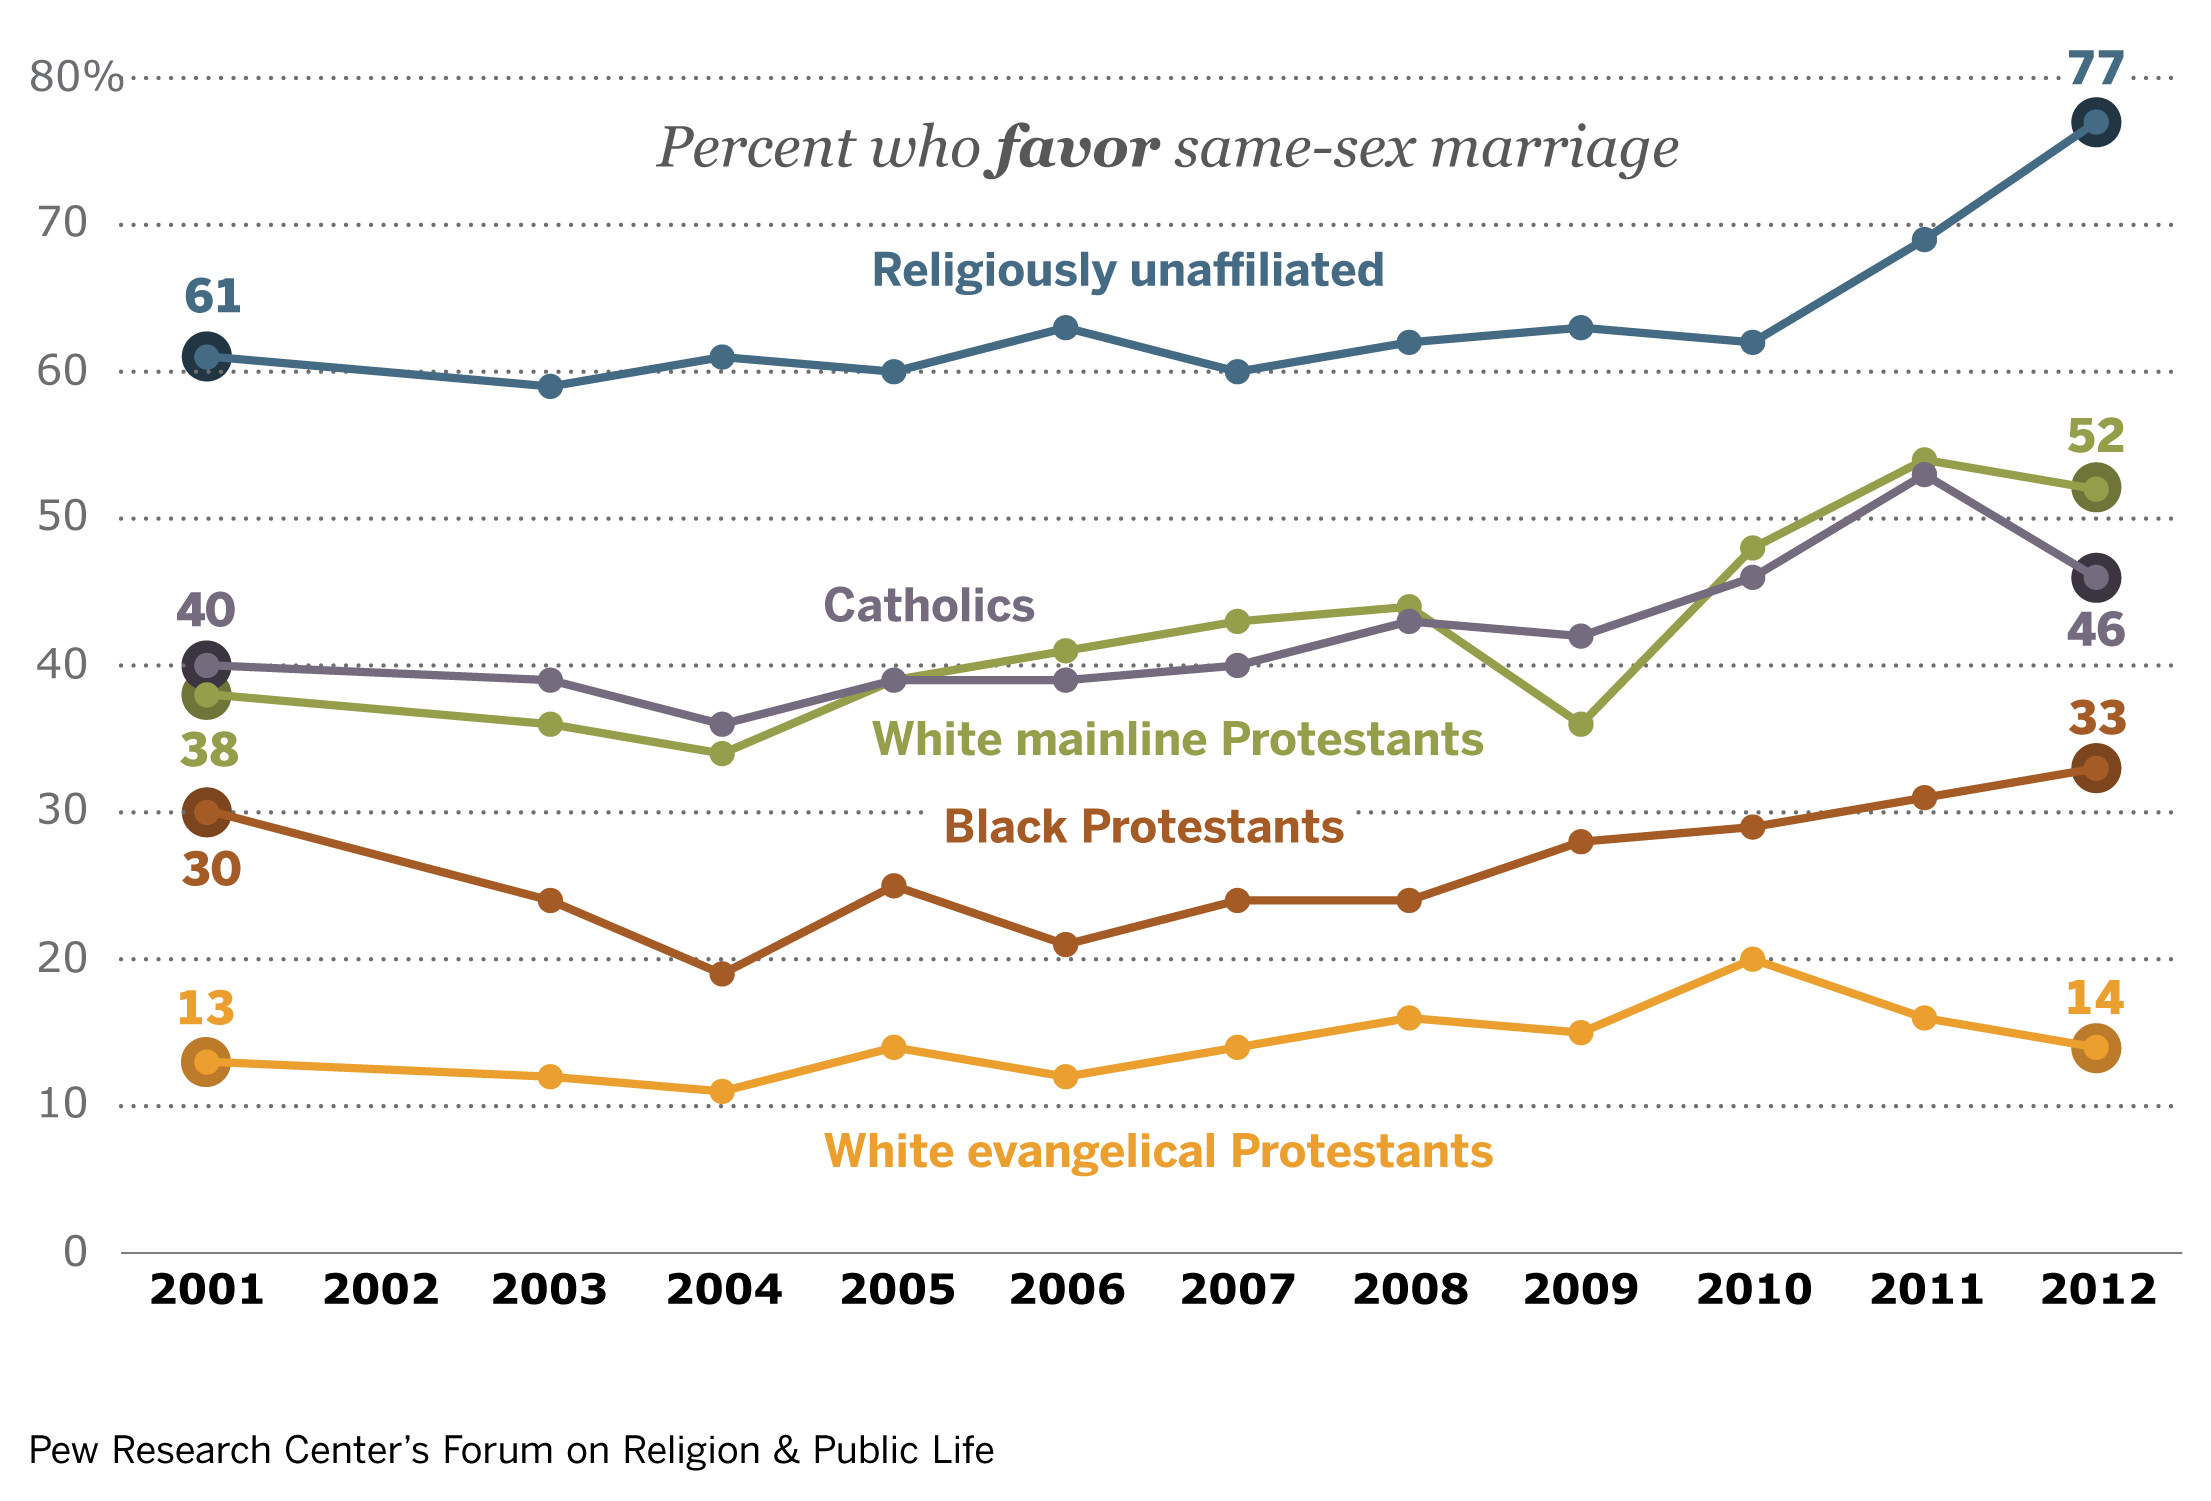
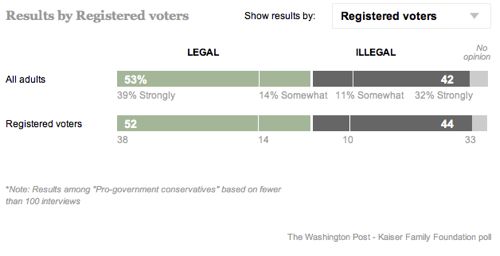
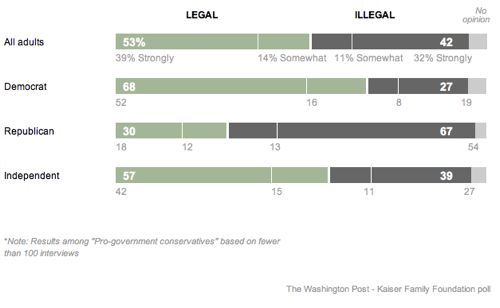
Opinion by political party: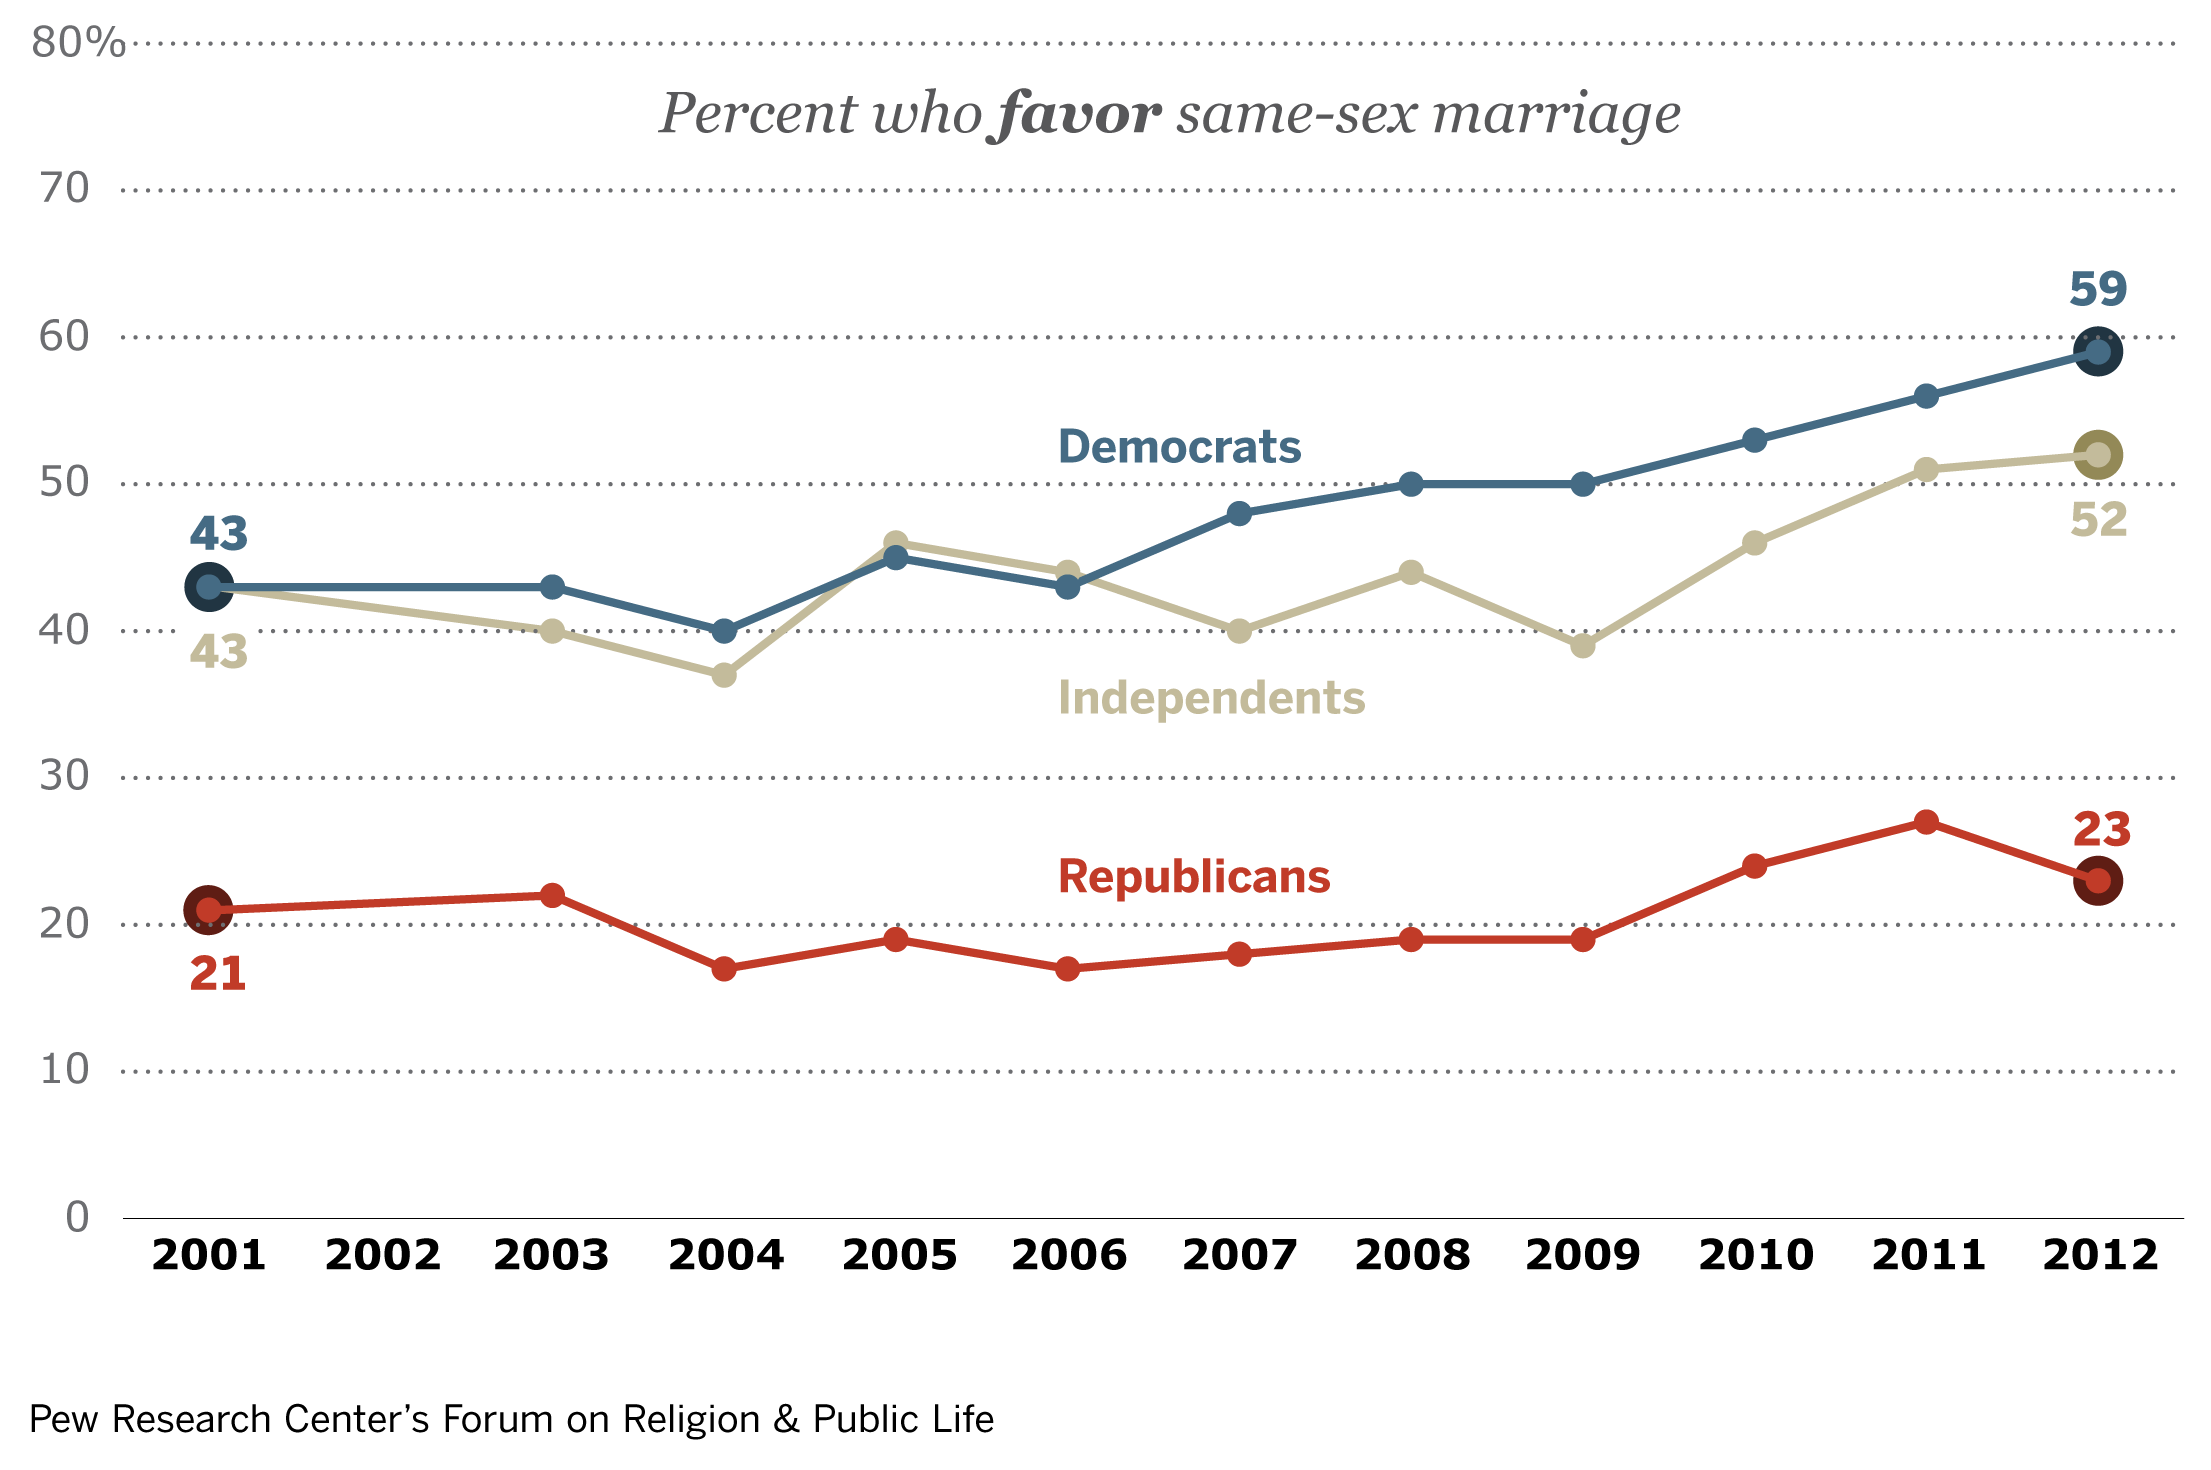
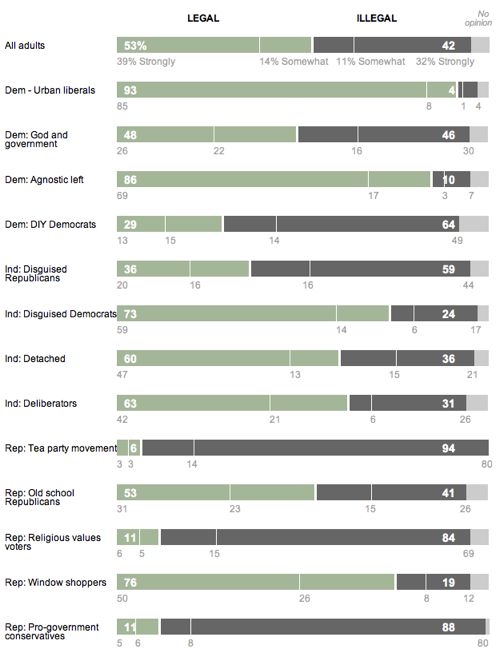
Opinion by political orientation: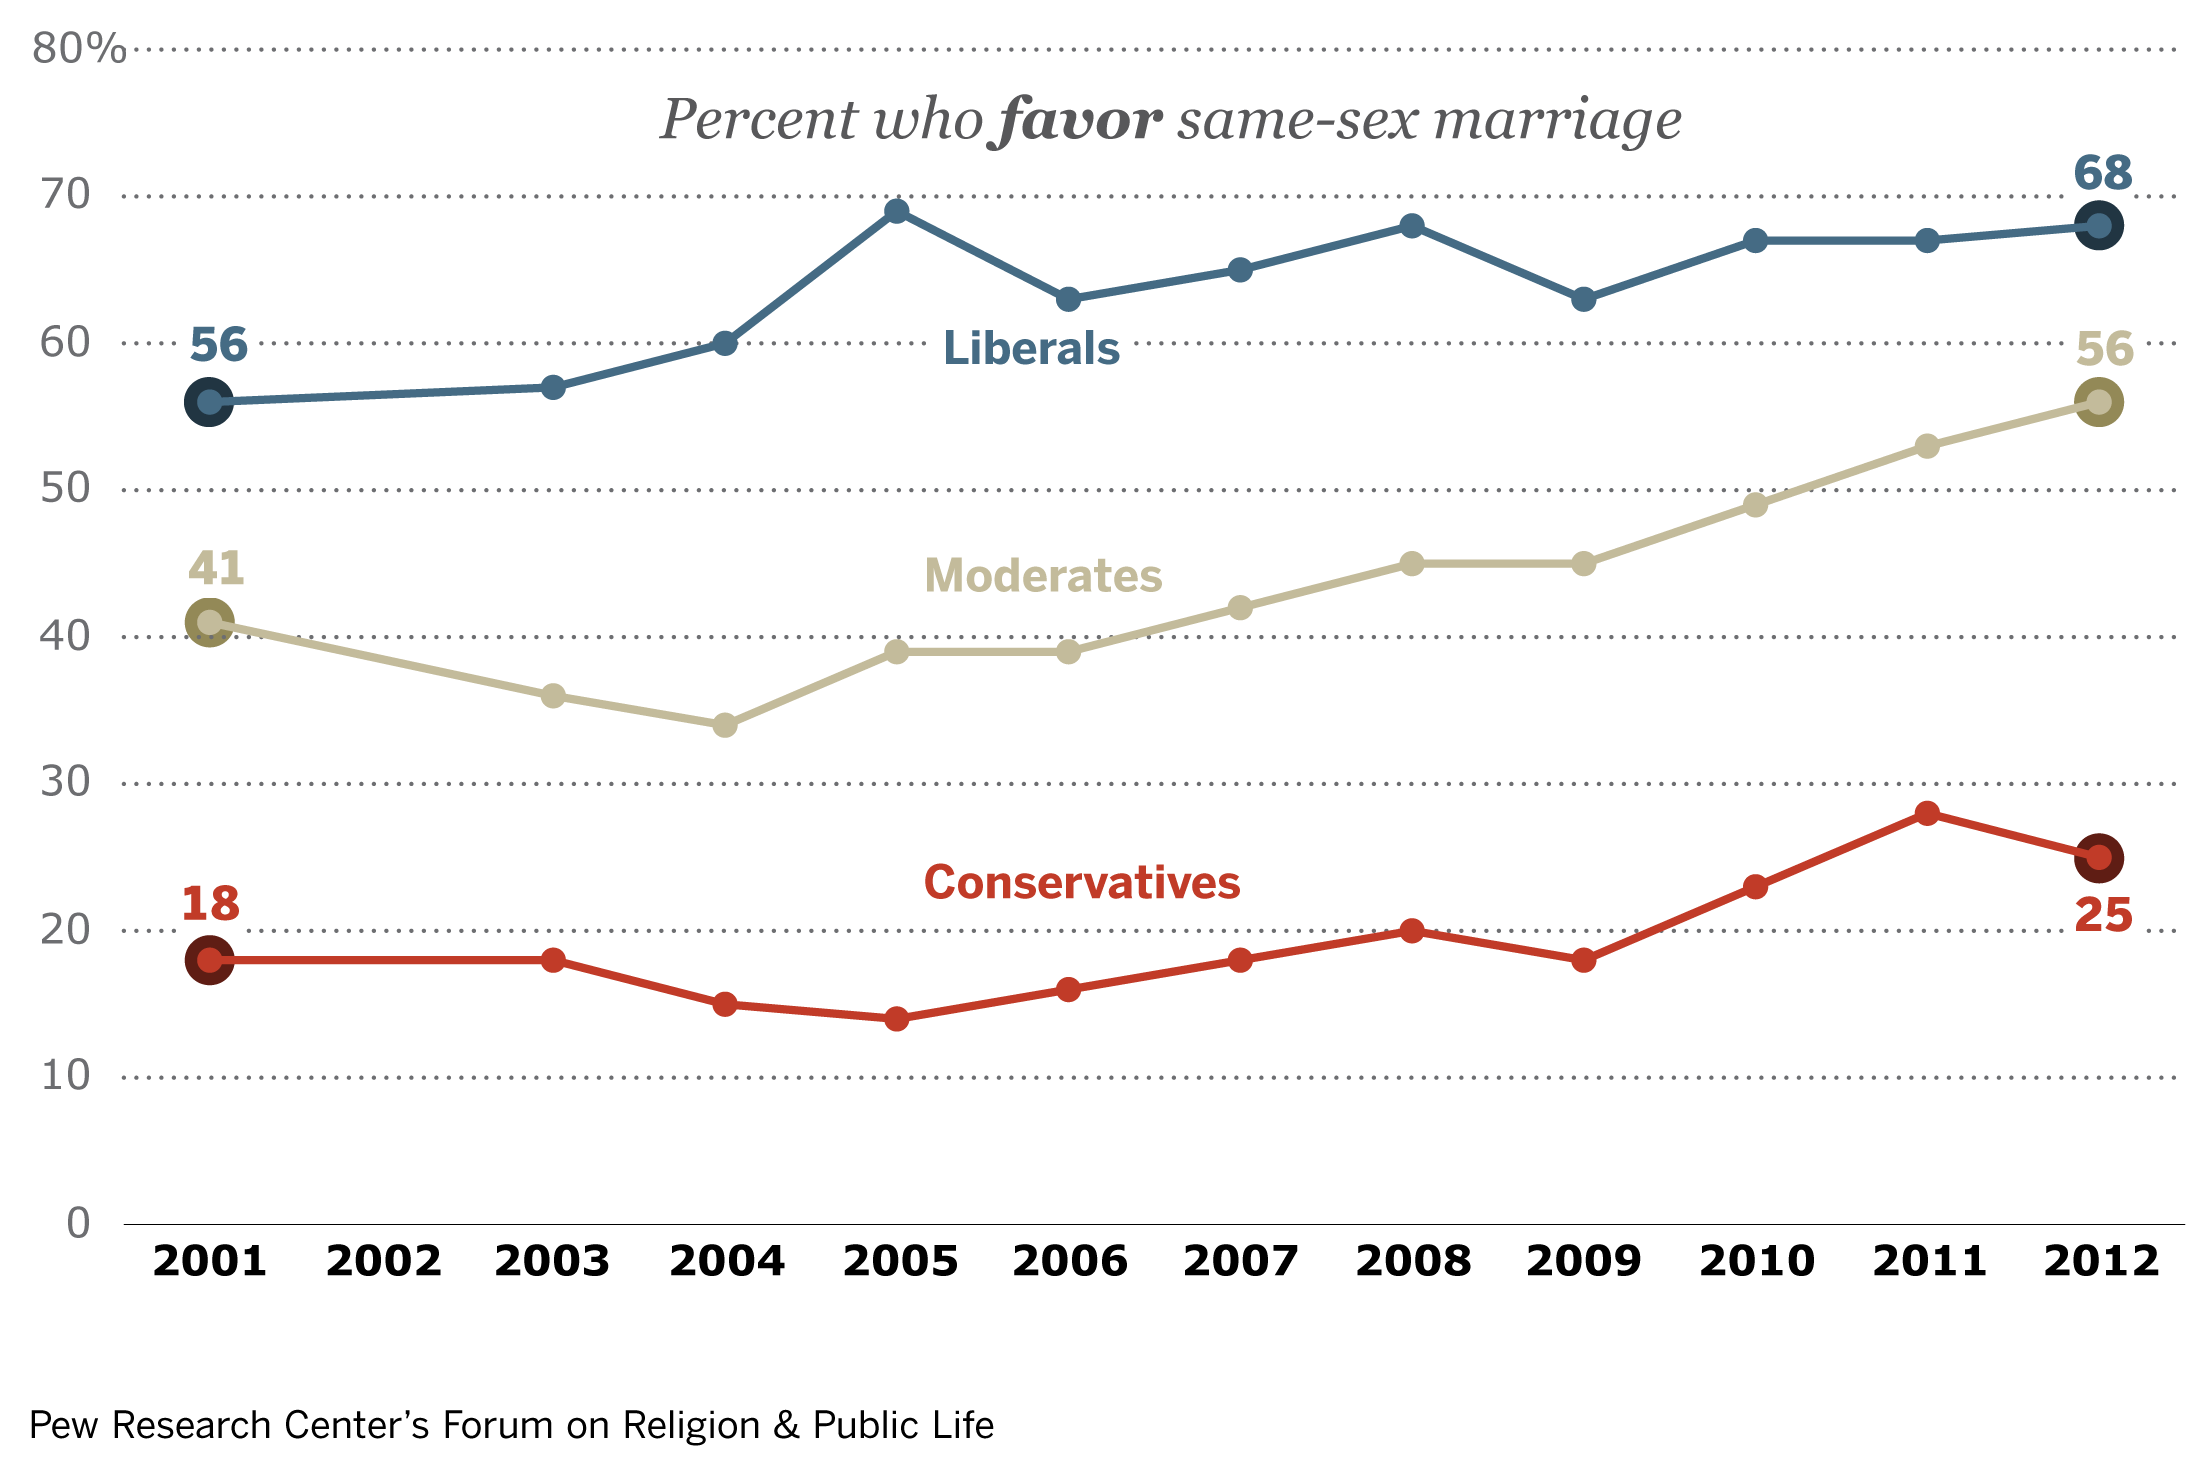
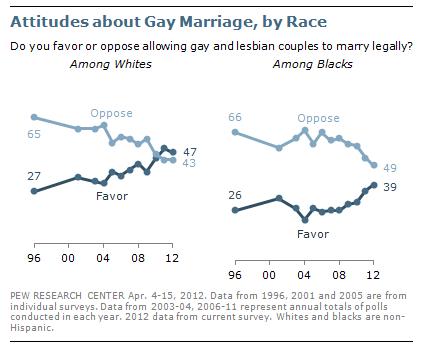
Opinion by race: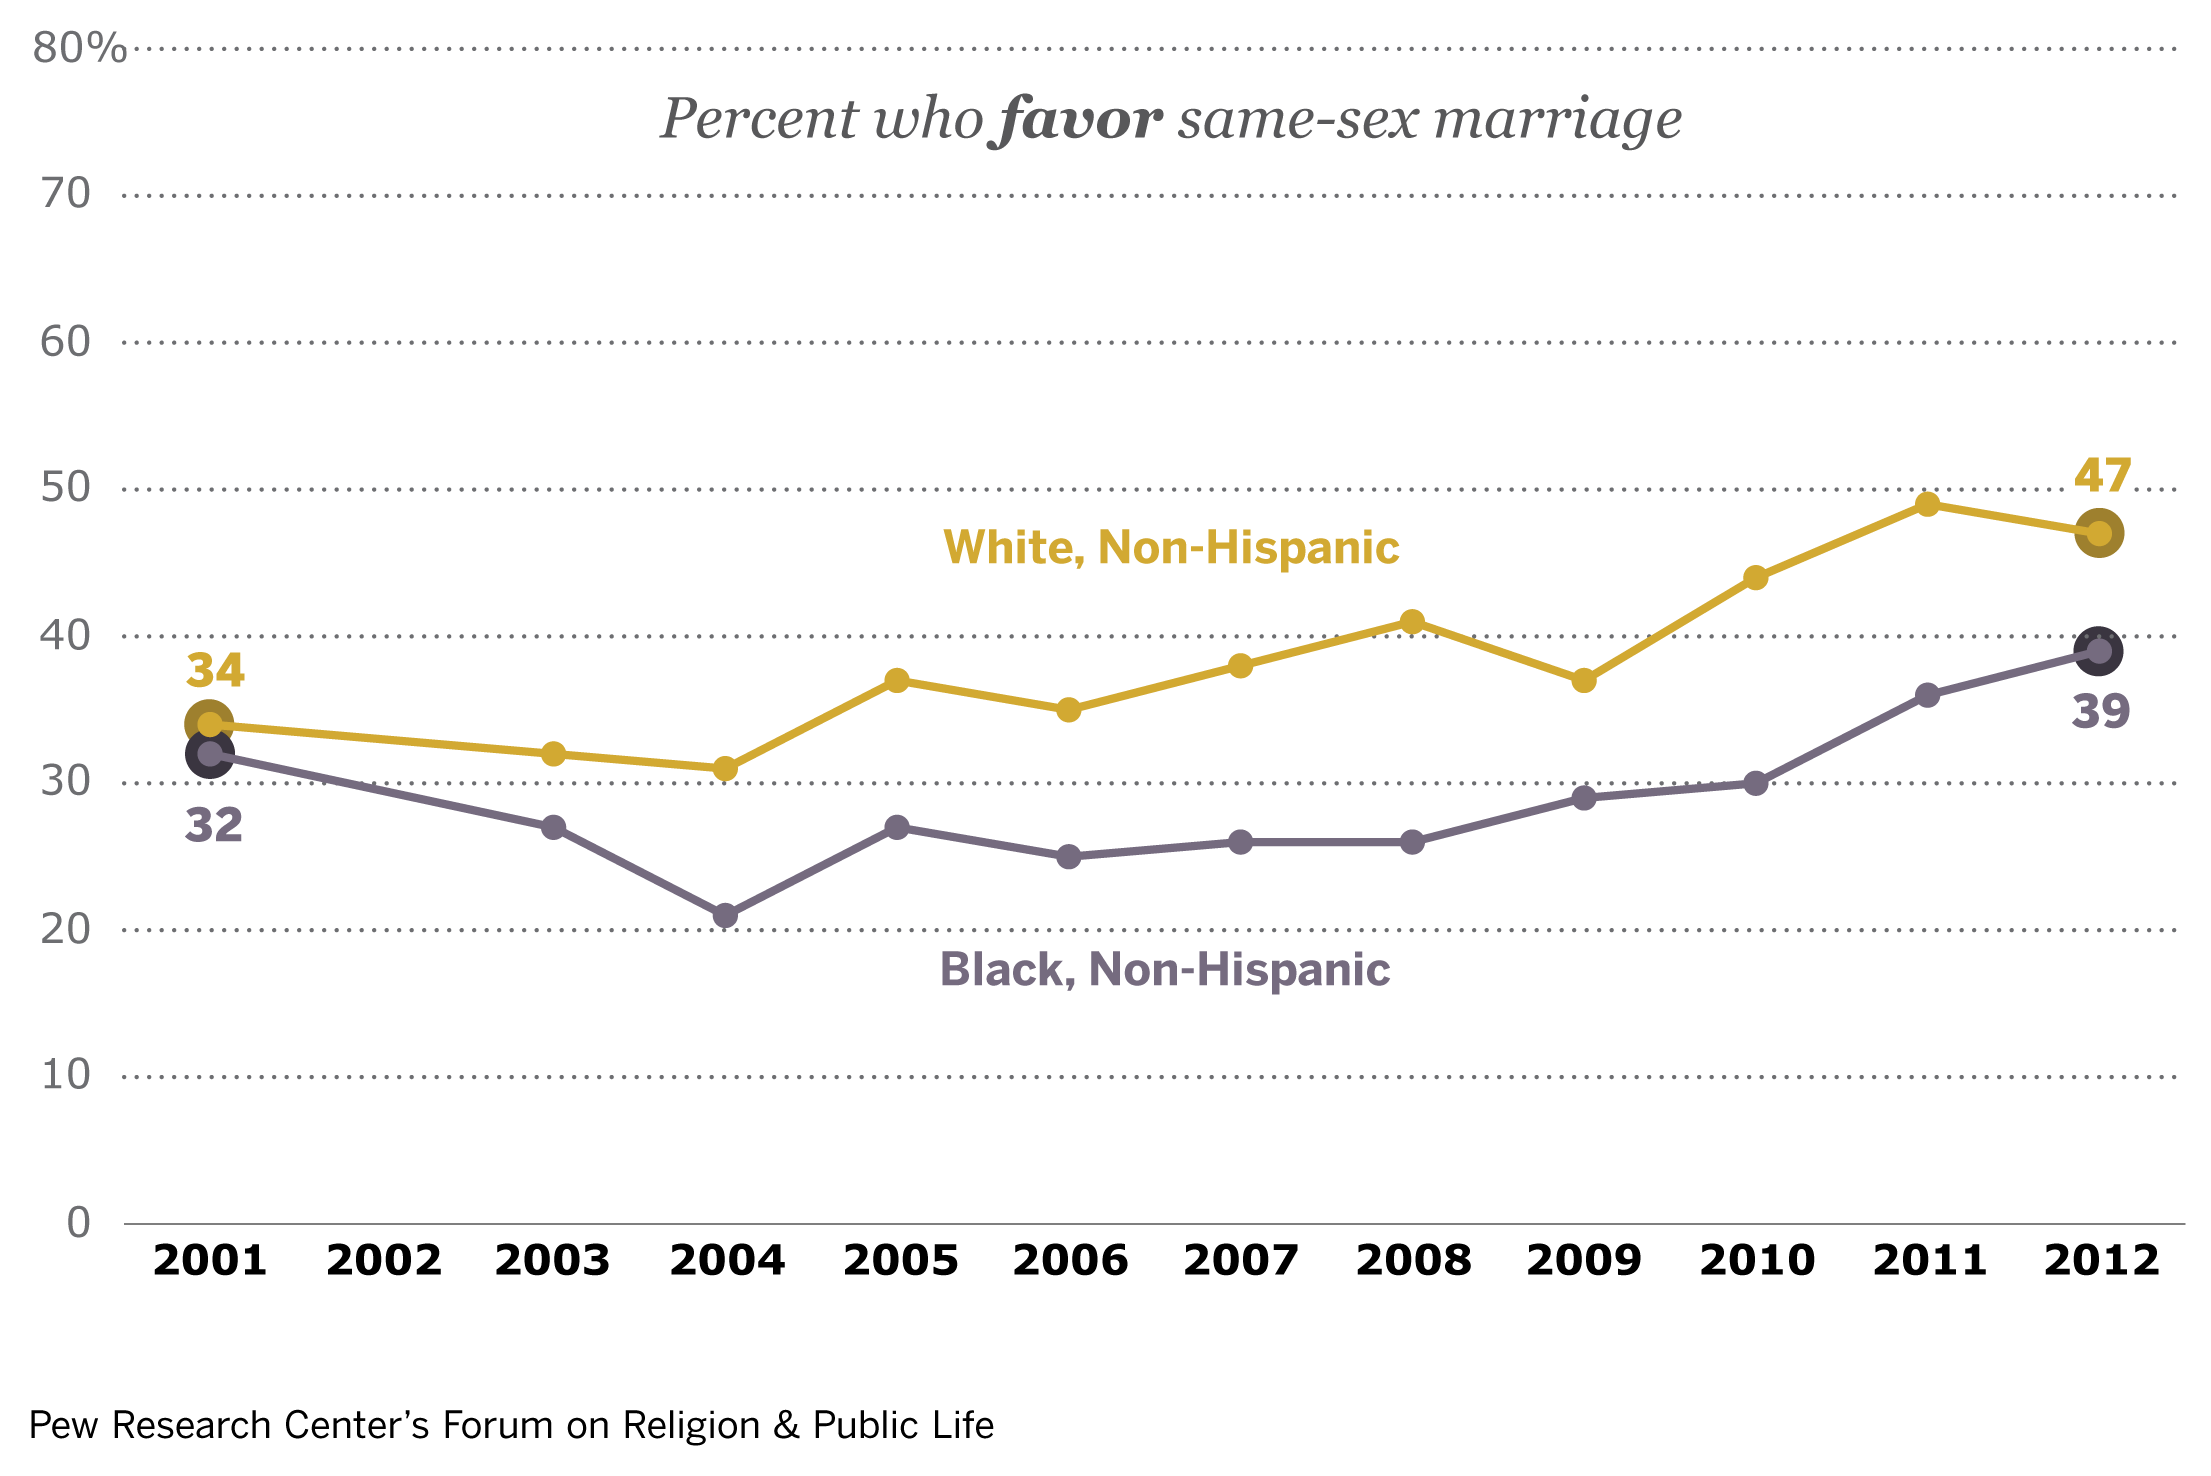
Opinion by gender: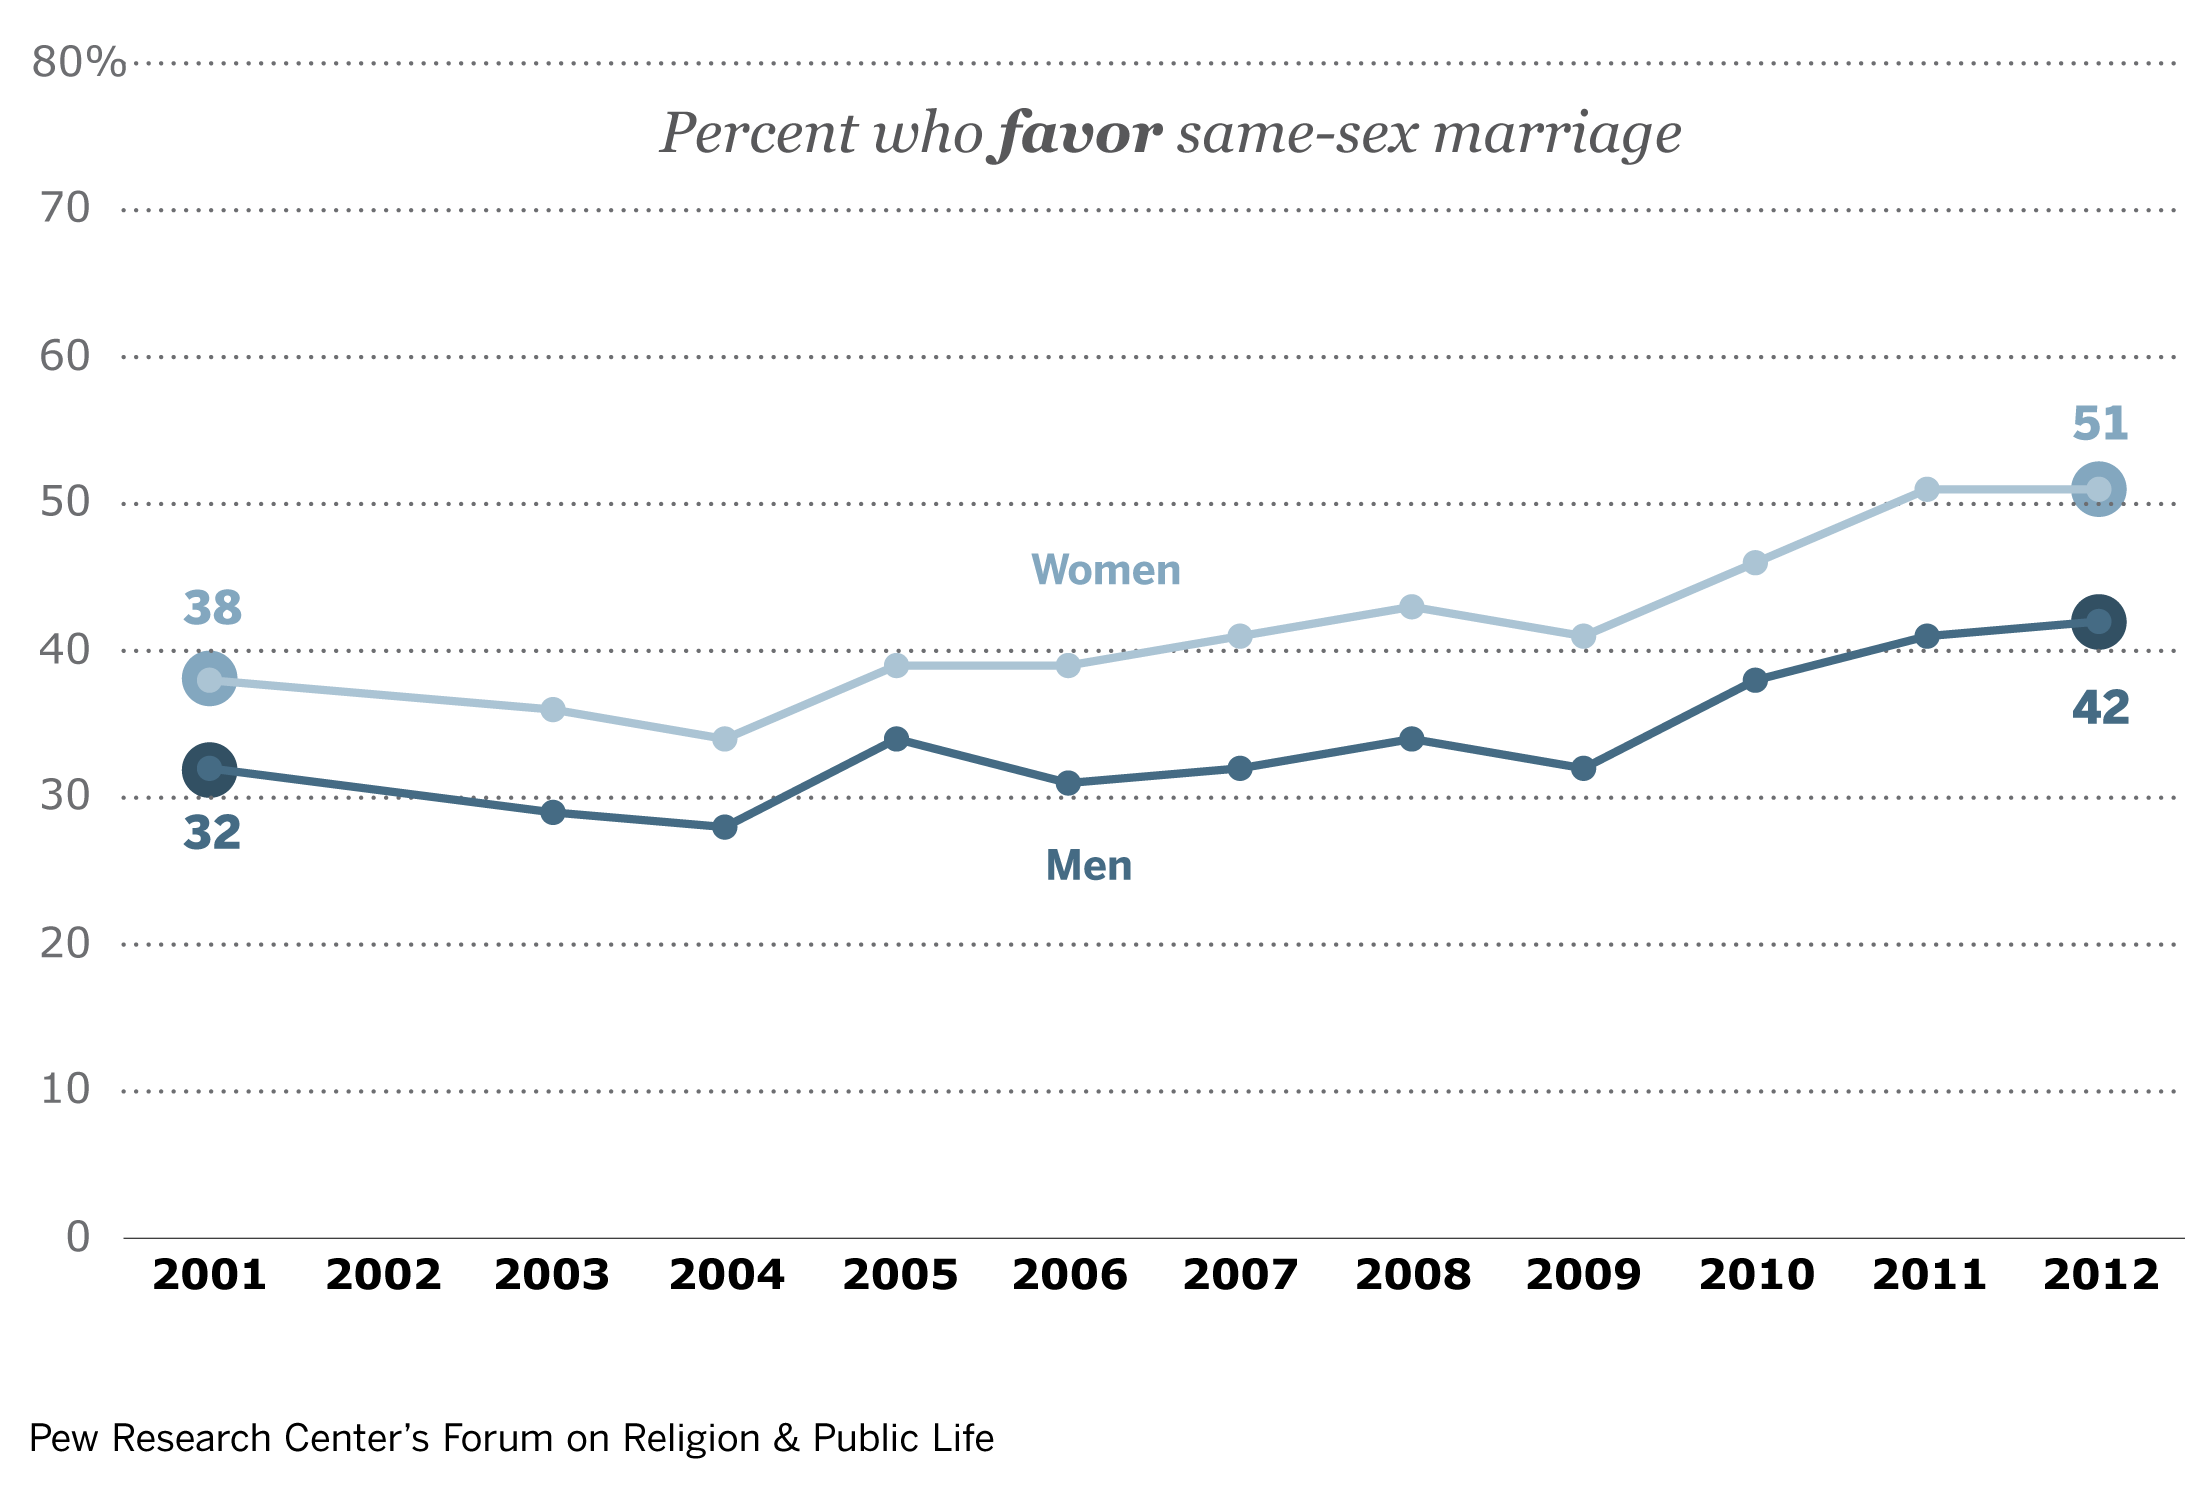
Via Montclair SocioBlog.
Lisa Wade, PhD is an Associate Professor at Tulane University. She is the author of American Hookup, a book about college sexual culture; a textbook about gender; and a forthcoming introductory text: Terrible Magnificent Sociology. You can follow her on Twitter and Instagram.