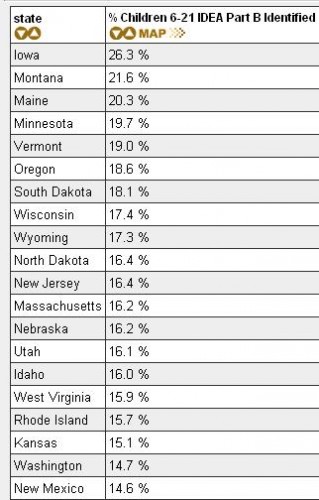
Rachel F. sent in a link to a site sponsored by the National Center for Culturally Responsive Educational Systems that provides a lot of information on rates of children diagnosed as in need of special education services, broken down by race. For instance, this map shows the proportion of African-Americans aged 6-21 who qualified for special ed services in 2006-2007 for all disabilities (you can also select a specific disability). The states are arranged into quintiles (so each color includes 20% of the states):
I always prefer to know the exact percentages, so I clicked on the Tables tab at the top of the page and looked at the Special Education Rates by Race and Disability link. Here are the percentages for the map above (just the first page of the table):
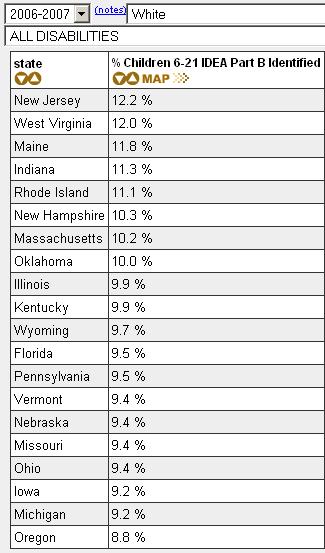
Here’s the equivalent data for Whites (again, page 1 of the table):
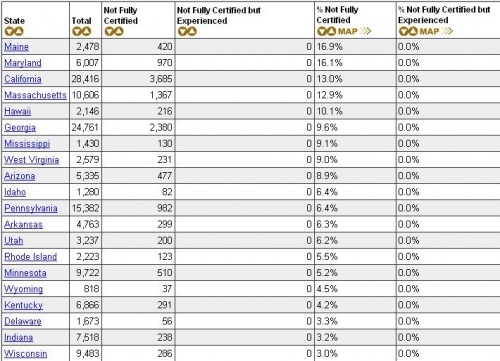
The site also provides info on teacher certification (look under the Tables tab). Here’s page 1 of a table of the states ranked by the % of special-ed teachers who are not fully certified in special education:
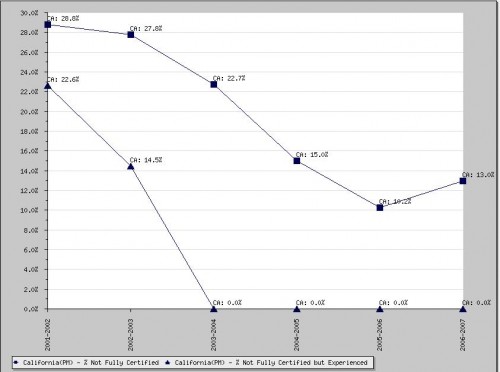
If you go to the map and click on a state, you can get the trend in certification over time. This shows special ed teachers who aren’t fully certified in California:
Of course, there are all sorts of interesting questions about special ed that this data set doesn’t address. The evidence is pretty clear that boys are more likely to be diagnosed as having a learning disability than girls are, and some critics suggest that behavioral issues like acting up and causing teachers headaches are becoming the basis of a diagnosis that can have life-long consequences for teachers’, parents’ and students’ expectations about how they’ll do in school. Insofar as perceptions of behavior are affected by a student’s race (see Ann Ferguson’s Bad Boys: Public Schools in the Making of Black Masculinity), this could have particularly negative consequences for some groups.
Interpreting rates of use of special ed programs is hard, too. Does the fact that Black kids in Iowa have much higher rates of qualifying for special ed courses than Black kids in Mississippi do mean that there are more disabilities in Iowa? Or that kids there benefit from better screening to identify kids who might benefit from the classes?
Aside from that, thoughts on what might be causing the dramatic differences in rates between states and between race/ethnicities?


