
That large (and largely trademarked) sporting event is this weekend. In honor of its reputation for massive advertising, Lisa Wade tipped me off about this interesting content analysis of last year’s event by the Media Education Foundation.
MEF watched last year’s big game and tallied just how much time was devoted to playing and how much was devoted to ads and other branded content during the game. According to their data, the ball was only in play “for a mere 18 minutes and 43 seconds, or roughly 8% of the entire broadcast.”
MEF used a pie chart to illustrate their findings, but readers can get better information from comparing different heights instead of different angles. Using their data, I quickly made this chart to more easily compare branded and non-branded content.
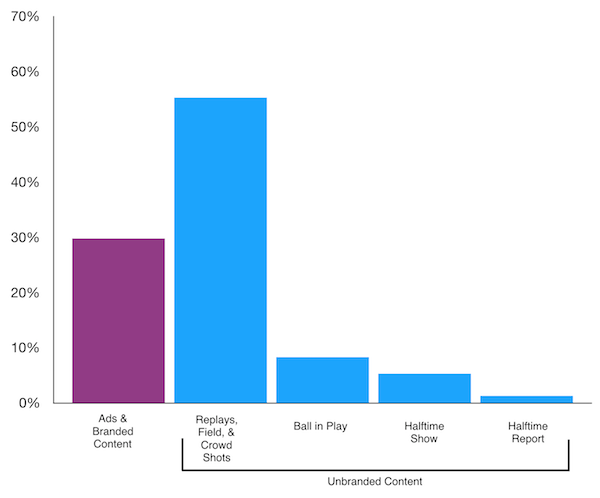
One surprising thing that jumps out of this data is that, for all the hubbub about commercials, far and away the most time is devoted to replays, shots of the crowd, and shots of the field without the ball in play. We know “the big game” is a big sell, but it is interesting to see how the thing it sells the most is the spectacle of the event itself.
Evan Stewart is an assistant professor of sociology at University of Massachusetts Boston. You can follow his work at his website, or on BlueSky.
Comments 13
DavuReuret — November 1, 2020
All to each and every lively grown-up and consuming accomplices who are set to make their life safe. So you will have the choice to utilize stimulating security systems that will persistently make your life strikingly https://homenetrouter.com/centurylink/ guaranteed. There will continually be an ability to put a camera that will screen all that occurs in the house
nilson — May 26, 2021
I am currently using https://getprospect.com/crm in order to widespread business better. This web tool helps to get more customers and clients within a short period of time. You are getting all in order, synchronize lists and automate workflows, make everything in order.
Sufia Arsala — August 12, 2022
This blog is so effective and attractive because of its visual presentation. Visualization is the best source to teach anyone about anything. I want to introduce you to the best SEO experts in Karachi , Pakistan who allows a 50% discount on your first service that saves your money and helps your website to rank better on google search pages as well.
totoguy — December 6, 2022
I would like to compliment you for your expert opinion on the subject you have written. How can you understand it so easily? Also, how good the quality of information is. I know your efforts to write this article better than anyone else. Thank you for sharing a good message. 메이저사이트
totoright — December 6, 2022
I also benefit from learning to evaluate, but I learn that many people have to stay in their essays to add value in the direction of true weblog presentation. 먹튀사이트
WebNagar — March 9, 2023
We are Top SEO Specialist in Karachi, Pakistan. We are advanced online marketing agency. You can benefit from us for any type of digital marketing services and we can help you to grow your business not just in Karachi but all over Pakistan.
Anonymous — November 29, 2024
It’s fascinating to see how much of the broadcast during such a massive sporting event is devoted to everything but the actual game. This breakdown really highlights how the spectacle itself, along with the branding and storytelling around it, becomes the main attraction. Similarly, in the world of apps and gaming, tools like Lulubox pro download play a pivotal role in enhancing user experience. Just as advertisers capitalize on every second of airtime to engage audiences, Lulubox optimizes gameplay by unlocking premium features and improving functionality, making sure every moment spent in an app feels worthwhile and immersive.
Everett — March 13, 2025
This analysis of the "big game" really sheds light on how much of the broadcast is about spectacle rather than the actual sport. It's fascinating to see how advertising and branding dominate such events, making the "game" feel more like a commercial showcase. This concept of maximizing content for commercial value is something we see in other areas too. For example, when creating engaging visual content, apps like Picsart mod web allow users to enhance and customize their images freely, enabling better storytelling and content creation. Just as advertisers use these events to captivate an audience, we can use creative tools like Picsart APK to connect with others and share our unique perspectives.
kashif kashif kashif — July 24, 2025
I enjoy every single posts, I actually appreciated, I would personally adore extra information and facts because of this, mainly because its fairly pleasing., Have fun here ideal for allowing. 비아그라 구매
kashif kashif kashif — July 25, 2025
i like chaning tatum because he has a great body, just look at those chest muscles.. nowgoal
odis hale — December 23, 2025
Sportzfy TV APK is a lightweight streaming app that offers live sport channels, matches and highlights in one place. It support smooth playback with multiple links and simple navigation for quick access. For more details visit https://app-sportzfytv.com/
James Rodri — April 23, 2026
Thanks for the information,o Cinema APK sem anúncios uma opção ainda mais atraente.
Jay Myers — May 24, 2026
Thanks its a great and best blog for more new and updated ideas you can install onstream which gives you a best information!