international comparisons

Yesterday’s killing was the 39th school shooting in the U.S. this year.  Most of those got little press coverage. Unless someone is actually killed, a shooting might not even get coverage in the local news.

Yesterday’s did.

Why would an apparently happy kid shoot several classmates? That seems to be the question that’s getting the attention of the press and perhaps the public. “Struggling to Find Motive,” said one typical headline. That’s the way we think about school shootings these days.

It’s unlikely that any of the motives that turn up will be all that strange. Fryberg may have been upset by a racial comment someone had made the day before or by a break-up with a girl. He may have had other conflicts with other kids. Nothing unusual there.

But “why” is not the question that first occurs to me. What I always ask is how a 14-year old kid can get his hands on a .40 Beretta handgun (or whatever the weaponry in the shooting of the week is).  For Fryberg it  was easy. The pistol belonged to his father. Nothing strange there either.  Thirty million homes in the US, maybe forty million, are stocked with guns.

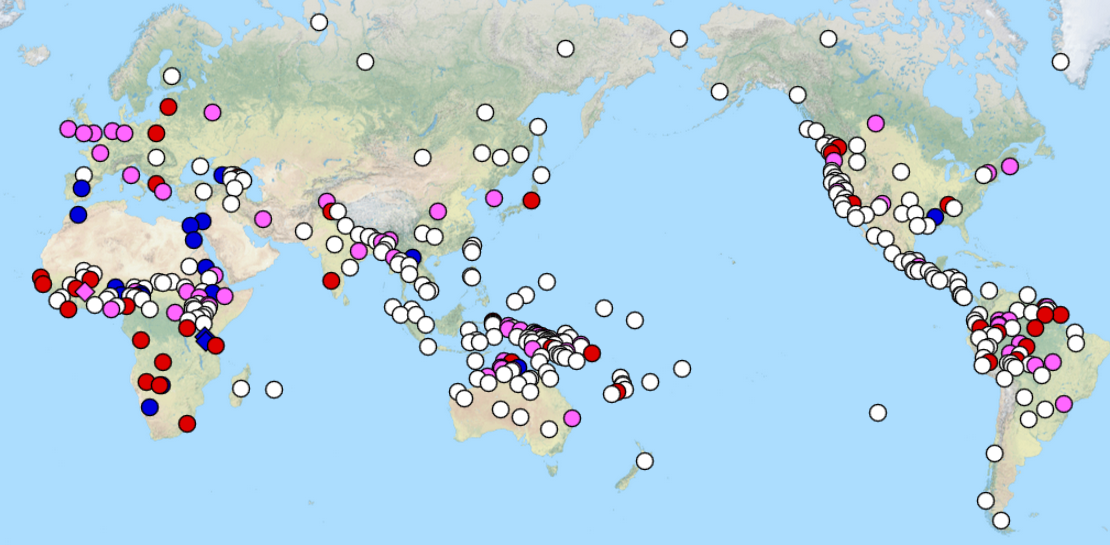
Do European countries have school shootings like this? Surely kids in Europe get upset about break-ups; surely they must have conflicts with their classmates; and surely, some of them may become irrationally upset by these setbacks.  So surely there must have been school shootings in Europe too.

I went to Wikipedia and looked for school shootings since 1980 (here and here).  I eliminated shootings by adults (e.g., Lanza in Sandy Hook, Brevik in Norway). I also deleted in-school suicides even though these were done with guns and were terrifying to the other students. I’m sure my numbers are not perfectly accurate, and the population estimate in the graph below  is based on current numbers; I didn’t bother to find an average over the last 35 years. Still the differences are so large that I’m sure they are not due to technical problems in the data.

1 (3) - Copy
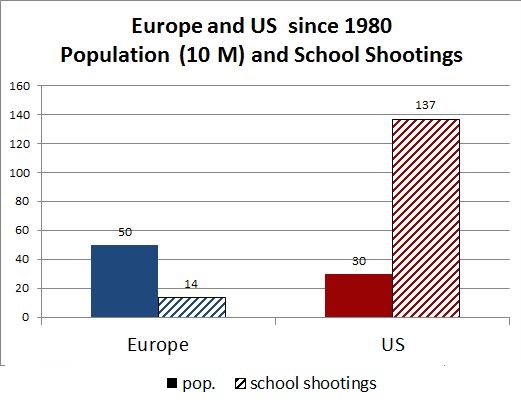
Does the U.S. have a much greater proportion of kids who are mentally unstable? Do our schools have more bullying? Are European kids more capable in dealing with conflicts? Are they more stable after break-ups? Do they spend less time with violent video games? Do their schools have more programs to identify and counsel the potentially violent?  I’m not familiar with the data on these, but I would guess that the answer is no and that our kids are no more screwed up than kids in Europe. Or if there are differences, they are not large enough to explain the difference in the body count.

No, the important difference seems to be the guns.  But guns have become the elephant in the room that nobody talks about.  Even asking about access to guns seems unAmerican these days.  Thanks to the successful efforts of the NRA and their representatives in government, guns have become a taken-for-granted part of the landscape. Asking how a 14-year old got a handgun is like asking how he got a bicycle to ride to school.

When the elephant’s presence is too massive not be noticed – for example, when the elephant kills several people –  the elephant’s spokesmen rush in to tell us that “No, this is not the time to talk about the elephant.”  And so we talk about video games and psychological screening and parents and everything else, until the next multiple killing. But of course that too is not the time to talk about elephants.

Cross-posted at Pacific Standard.

Jay Livingston is the chair of the Sociology Department at Montclair State University. You can follow him at Montclair SocioBlog or on Twitter.

The map below is an interactive available at the World Atlas of Language Structures.  It represents an extensive, but not quite comprehensive collection of world languages. Each dot represents one. White dots are languages that do not include gendered pronouns. No “he” or “she.” Just a gender neutral word that means person.

2

The colored dots refer to languages with gendered pronouns, but there are more than one kind, as indicated by the Values key. The number on the right, further, indicates how many languages fit into each group. Notice that the majority of languages represented here (57%) DO NOT have gendered pronouns.

3The map at the site is interactive. Go there to click on those dots and explore.

Lisa Wade, PhD is an Associate Professor at Tulane University. She is the author of American Hookup, a book about college sexual culture; a textbook about gender; and a forthcoming introductory text: Terrible Magnificent Sociology. You can follow her on Twitter and Instagram.

Despite the cellphone video of two police officers killing Kajieme Powell, there is some dispute as to what happened (see this account in The Atlantic). Was Powell threatening them; did he hold the knife high; was he only three or four feet away? 

The video is all over the Internet, including the link above. I’m not going to include it here.  The officers get out of the car, immediately draw their guns, and walk towards Powell. Is this the best way to deal with a disturbed or possibly deranged individual – to confront him and then shoot him several times if he does something that might be threatening?

Watch the video, then watch London police confronting a truly deranged and dangerous man in 2011.  In St. Louis, Powell had a steak knife and it’s not clear whether he raised it or swung it at all.  The man in London has a machete and is swinging it about.


Unfortunately, the London video does not show us how the incident got started. By the time the recording begins, at least ten officers were already on the scene. They do not have guns. They have shields and truncheons. The London police tactic used more officers, and the incident took more time. But nobody died.  According to The Economist:

The police in and around Ferguson have shot and killed twice as many people in the past two weeks (Mr Brown plus one other) as the police in Japan, a nation of 127m, have shot and killed in the past six years. Nationwide, America’s police kill roughly one person a day.

The article includes this graphic:

1 (2)

I’m sure that the Powell killing will elicit not just sympathy for the St. Louis police but in some quarters high praise – something to the effect that what they did was a good deed and that the victims got what they deserved. But righteous slaughter is slaughter nevertheless. A life has been taken.<

You would think that other recent videos of righteous slaughter elsewhere in the world would get us to reconsider this response to killing. But instead, these seem only to strengthen tribal Us/Them ways of thinking. If one of Us who kills one of Them, then the killing must have been necessary and even virtuous.

Originally posted at Montclair SocioBlog.

Jay Livingston is the chair of the Sociology Department at Montclair State University. You can follow him at Montclair SocioBlog or on Twitter.

According to the Stockholm International Peace Institute, the United States remains the world’s top military spender. In fact, U.S. military spending equals the combined military spending of the next ten countries.  And most of those are U.S. allies.

1 (2) - Copy

Although declining in real terms, the U.S. military budget remains substantial and a huge drain on our public resources.  As the following chart shows, military spending absorbs 57% of our federal discretionary budget.

1 (2)

 Notice that many so-called non-military discretionary budget categories also include military related spending. For example: Veteran’s Benefits, International Affairs, Energy and the Environment, and Science.   We certainly seem focused on a certain kind of security.

Martin Hart-Landsberg is a professor of economics at Lewis and Clark College. You can follow him at Reports from the Economic Front.

Mean and median are two measures of “average.”  The mean is the average as we typically think of it: the sum of things divided by the total number of things.  The median, in contrast, is literally the number in the middle if we align all the quantities in order.  People often use median instead of mean because it is insensitive to extreme outliers which may skew the mean in one direction or another.

For a quick illustration of the difference, I often use the example of income. I choose a plausible average (mean) for the classroom population and review the math. “If Bill Gates walks into the room,” I say, “the average income is now in the billions. The median hasn’t moved, but the mean has gone way up.” So has the Gini coefficient.

Here’s a more realistic and global illustration – the net worth of people in the wealthier countries.  The U.S. ranks fourth in mean worth – $301,000 per person…

1 (2) - Copy

…but the median is far lower – $45,000, 19th out of the twenty nations shown.  (The graph is from Credit Suisse via CNN.)

The U.S. is a wealthy nation compared with others, but  “average” Americans, in the way that term is generally understood, are poorer than their counterparts in other countries. 

Jay Livingston is the chair of the Sociology Department at Montclair State University. You can follow him at Montclair SocioBlog or on Twitter.

This chart comes from Chuck Marr at the Center on Budget and Policy Priorities.  As Marr explains:

The United States is a relatively low-tax country, as the chart shows.  When measured as a share of the economy, total government receipts (a broad measure of revenue) are lower in the United States than in any other member of the Organization for Economic Co-operation and Development (OECD), even after accounting for the modest revenue increases in the 2012 “fiscal cliff” deal and the taxes that fund health reform.

1 (2) - Copy

Martin Hart-Landsberg is a professor of economics at Lewis and Clark College. You can follow him at Reports from the Economic Front.

Excess under age-60 female mortality in less developed countries is estimated to add up to 3.9 million missing women worldwide (World Bank, 2011).  A large proportion of this is due to sex-selective abortion practices.  The practice occurs most commonly among poorer families in societies where boy children are given greater economic and social status than girl children. In such a context, the transition to smaller families can lead parents to choose boys over girls. Notably, female fetuses are most likely to be aborted when the first child born is a girl.

The table below shows the countries with the most skewed ratios at birth in the world. While there is naturally a slightly higher sex ratio of boys to girls — between 1.04-1.06 — ratios above that are considered to be altered by technology due to gender preferences for boy children.

Screenshot_1

The reason we find this newest 2013 data of particular interest is that, despite the popular Western focus on Asia, the practice occurs in more European countries. Perhaps most striking is the central European country that ranks at the top of the list—Liechtenstein. This strikes us as odd, given that Liechtenstein has never made this list in the past. Perhaps this is a data collection error (in very small populations, as also in Curacao, the results can be skewed). But we are surprised that no journalists have picked up on the fact that the worst offending son-preference country in the world is now, allegedly, a European country.  We contacted the CIA to ask them about this possible data anomaly but have not yet heard back.*

On the other hand, if the Liechtenstein data is accurate, this would be a very interesting story indeed, especially since Liechtenstein has the most restrictive laws against abortion in Europe.  A quick scan of gender equity policies in Liechtenstein shows that women there were not legalized to vote until 1984, indicating that it is not the most gender egalitarian of European countries.

In any case, whether Liechtenstein’s inclusion in this disreputable list is a data error or not, the other European countries on the list are legitimate.  They have been high for many years, and a recent report on Armenia, for example, documents longstanding norms in gender preference.  The disproportionate focus on birth sex ratios in China and India no doubt reflects their status as the #1 and #2 most populous countries, which means a much greater overall impact in sheer numbers.  Nevertheless, our point stands.  Why has the disproportionate inclusion of non-Asian countries on the above-list gone virtually unmentioned by journalists?

Do Developed Western Countries Prefer Boys?

Americans often think of parental sex preference as a thing of the past, or a problem in developing countries. After all, the U.S. sex ratio at birth falls in the normal range, at 1.05. This is in spite of the curious American cottage industry in sex-identification home use kits, such as the Intelligender, the GenderMaker and the Gender Mentor.

Screenshot_2

In surveys, American parents report an ideal of two children and equal preference for boys and girls. However, American gender preferences manifest themselves in more sneaky ways. A 2011 Gallup poll showed that, if they were only able to have one child, the highest preference was for a boy.  These results are little changed from the same Gallup question asked of Americans in 1941.

To return to a point made in an earlier post on skewed sex ratios, Americans may not be so different, after all, in their gender preferences from the countries in the above table.  The crucial difference, she noted, is that some Asian countries are more enabled to act on their boy preference than others. It appears we should now be including some European countries in that “enabled” group as well.

* Neither the United Nations, Population Reference Bureau, nor the World Bank have published 2013 statistics yet for comparison to the CIA data.

Jennifer Lundquist is an associate professor of sociology at the University of Massachusetts, Amherst who specializes in stratification and social demography.
Eiko Strader is a PhD student in sociology at the University of Massachusetts, Amherst who studies inequality in labor markets and the welfare state.

Paraphrasing Donald Rumsfeld, there are things we know and things we don’t know, and things we know we don’t know, and things we don’t know we don’t know.

One thing many working people in American don’t know that they don’t know is how poor our social benefits are compare with those enjoyed by workers in other countries.  No doubt one reason is the general media blackout about worker experiences in other countries.  A case in point: vacation benefits.

The Center for Economic and Policy Research recently completed a study of vacation benefits in advanced capitalist economies.  Here is what the authors found:

The United States is the only advanced economy in the world that does not guarantee its workers paid vacation. European countries establish legal rights to at least 20 days of paid vacation per year, with legal requirements of 25 and even 30 or more days in some countries. Australia and New Zealand both require employers to grant at least 20 vacation days per year; Canada and Japan mandate at least 10 paid days off. The gap between paid time off in the United States and the rest of the world is even larger if we include legally mandated paid holidays, where the United States offers none, but most of the rest of the world’s rich countries offer at least six paid holidays per year.

vacations

Even though paid vacations and holidays are not legally required in the United States, some employers do provide them to their workers. The table below shows the paid vacations and paid holidays offered in the U.S. private sector based on data from the 2012 National Compensation Survey.  The first two columns show the percentage of private sector workers that receive paid leave, vacation and holidays.  The next two columns show the average number of paid vacation and paid holidays provided to those employees that receive the relevant benefit.  The last two columns show the average number of paid vacation and paid holidays for all private sector workers, meaning those that receive and those that do not receive the relevant benefits.

US data

Thus, on average, private-sector workers in the United States receive ten days of paid vacation per year and six paid holidays.  This total still leaves U.S. workers last in the rankings even when compared with the legal minimums highlighted above.  And many employers in these other countries also offer more paid leave than legally required.

Moreover, several countries require additional paid leave for younger and older workers, additions that are also not included in the legal minimums highlighted above.  For example, “in Switzerland, workers under the age of 30 who do volunteer work with young people are entitled to an additional five days of annual leave. Norway offers an additional week of vacation to workers over the age of 60.”

And some countries provide additional leave for workers with difficult schedules.  For example, “Australia offers some shift workers an additional work week of leave. Austria offers workers with ‘heavy night work’ two to three extra days of leave, depending on how frequently they do this shift work, and an additional four days of leave after five years of shift work.”

Several countries offer additional paid leave for jury service, moving, getting married, or community or union work.  For example, “French law guarantees unpaid leave for community work, including nine work days for representing an association and six months for projects of ‘international solidarity’ abroad and leave with partial salary for ‘individual training’ that is less than one year. Sweden requires employers to provide paid leave for workers fulfilling union duties.”

Austria, Belgium, Denmark, Greece, and Sweden even require employers to pay workers at a premium rate while they are on vacation.

There is more to say, but the point should be clear.  Ignorance of experiences elsewhere has narrowed our own sense of possibilities.

Martin Hart-Landsberg is a professor of economics at Lewis and Clark College. You can follow him at Reports from the Economic Front.