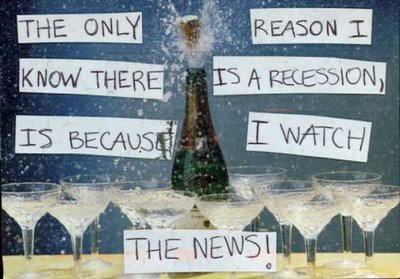
This PostSecret secret offers me an excuse to go on a rant:
Instead of an opportunity to start a national discussion about class, the recession appears to be stimulating a bunch of nationalist, and obfuscatory, rhetoric about our common condition.
If you listen to most media outlets they say that “America” is in recession. But not everyone in America is feeling the pain of this economic downturn equally. I, for example, have not lost my job, have not seen my pay cut, have not lost any benefits, and however much 401k money I’ve lost is rather irrelevant as I’m in my 30s and have no need for it right now. I am not suffering in this economic depression. In fact, I’m taking a junior sabattical next year and going half pay BY CHOICE.
Further, I keep hearing things like: “This is a great time to buy a house!” and “Stocks are cheap! You should invest in [insert random company here]!” (This advice is lost on a person who comes from humble beginnings and is voluntarily going half pay next year, but I digress.)
So, for many people, this economic downturn is kind of fantastic. Houses are cheap, stocks are cheap, and companies are offering great deals just to stay afloat. Plenty of people I know who are upper middle and upper class are considering this a great time to invest (see here for an example). They look forward to ultimately benefitting from this economic disaster.
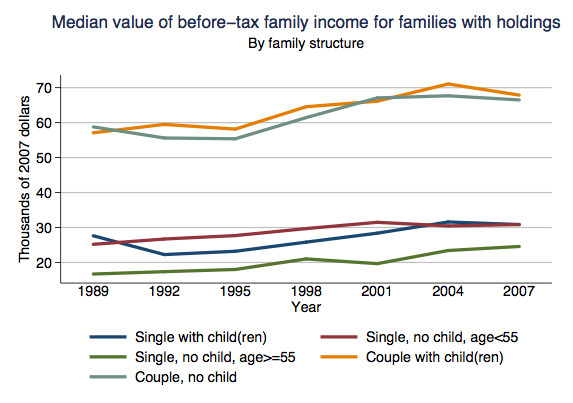
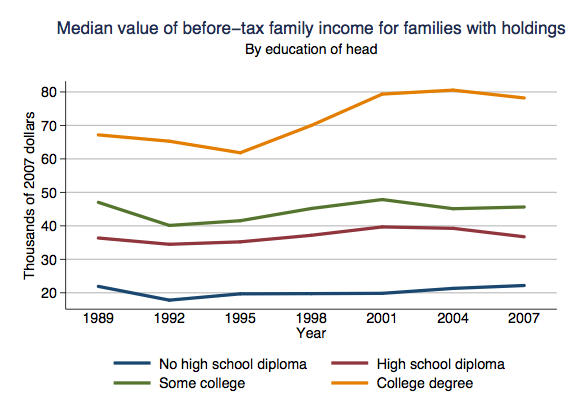
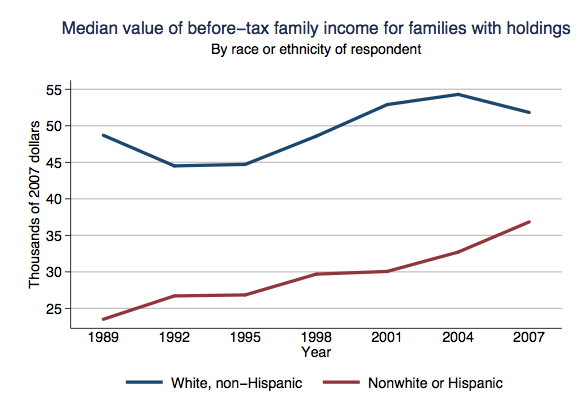
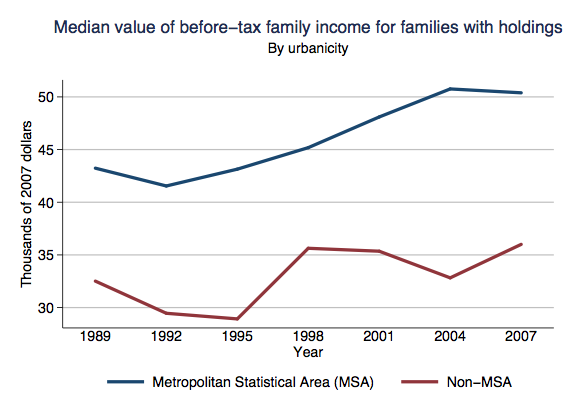
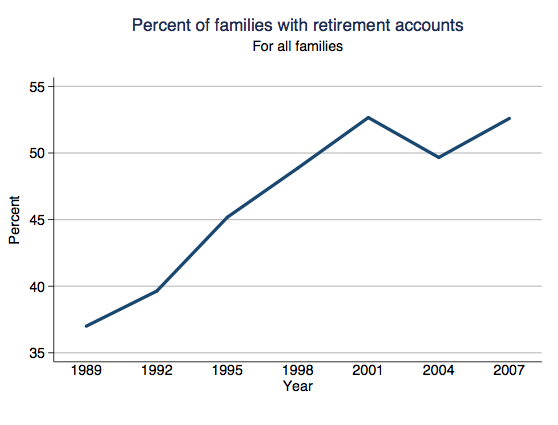
Lots of other people around me are suffering. If you’re already poor or working-class, out-of-work, near retirement or retired, struggling under an adjustable rate mortgage, (and I’m sure there are others I’m forgetting), you may be screwed.
So I wish we would stop talking about how “America” is in recession. This recession is hurting some kinds of people more than others. On the whole, those people who were underprivileged before the downturn are taking the brunt of it.
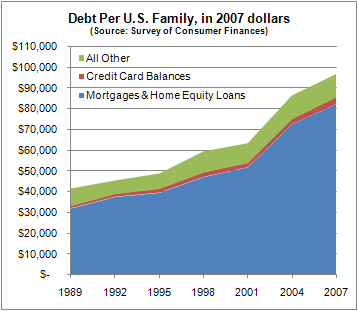
For more on the economy, visit these posts: increases in household debt, job loss and unemployment (here, here, here, and here), cessna responds to the attack on private jet travel, Walmart encourages moms to make the difference, an animated explanation of the credit crisis, images of the economic depression in Las Vegas (here and here), slumping car sales and overstocked lots, measuring the recession with beer sales, and changes in immigration.