
Nate Silver at FiveThirtyEight put up this graph of U.S. household debt (from the 2007 Survey of Consumer Finances):
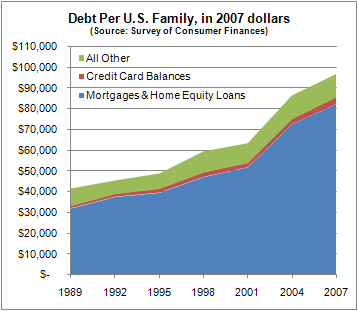
Silver says,
Per-family household debt increased by about 130% in real dollars between 1989 and 2007, from roughly $42,000 per family in 1989 to $97,000 eighteen years later. Most of that increase has come during the past six or seven years — household debt increased by 52% between 2001 and 2007 alone. Almost all of the debt (about 85%) falls into the category that the Fed calls “secured by residential property” — which means mortgages and home-equity loans.
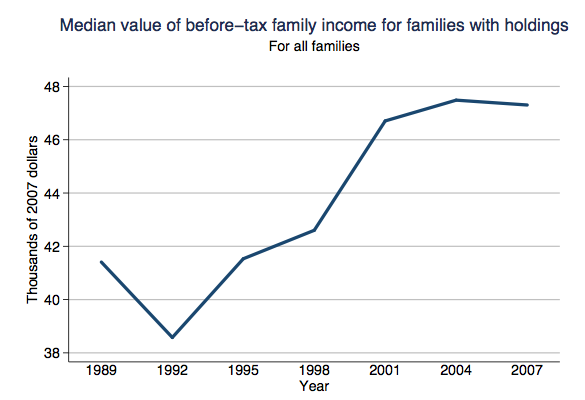
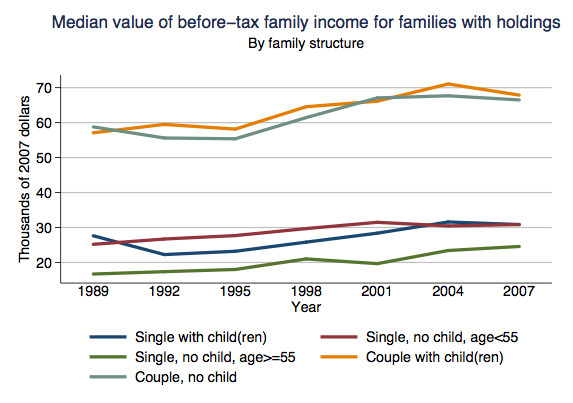
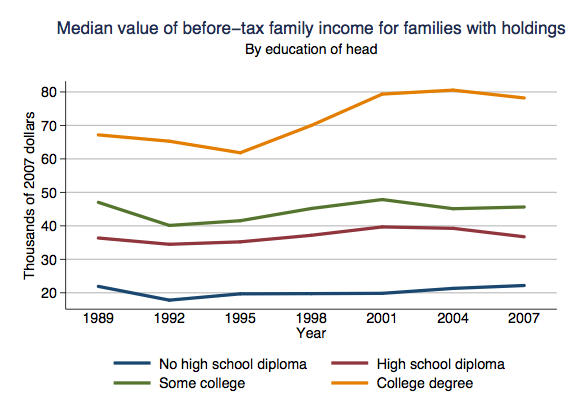
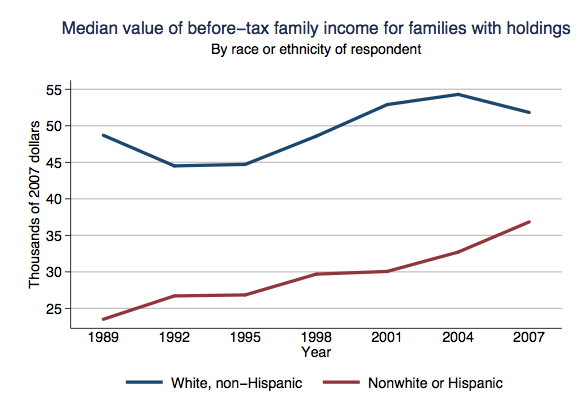
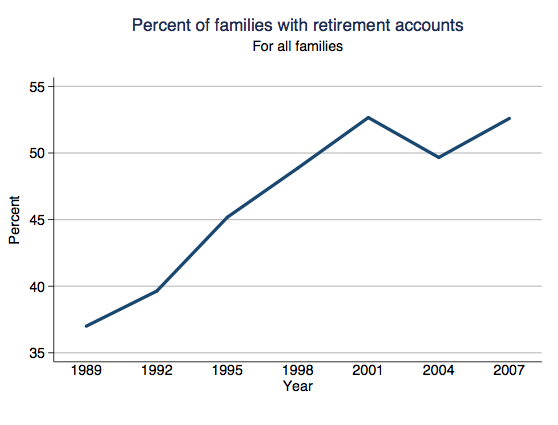
Some other images from the SCF Chartbook (available here)–and pay attention to the y axis, since the scale isn’t the same in all of them:
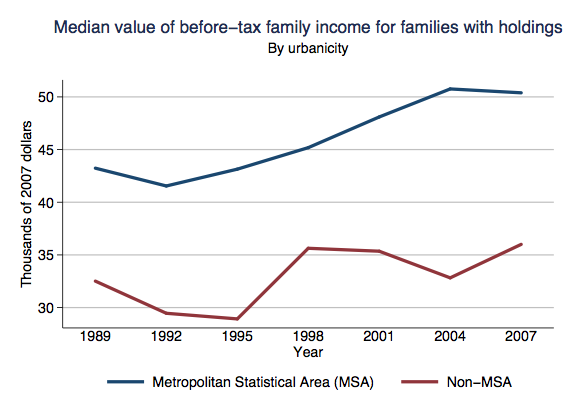
This next one is for rural (non-MSA) and urban (MSA) areas:
The Chartbook has images of the mean values for all these calculations as well, I just prefer the median to reduce the effects of outlier incomes.
Comments 4
North — March 27, 2009
All of these would be much more informative if placed on a zero-based graph, or at least graphed with the x-axis at some standard zero. The distance between, say, MSA and non-MSA income appears, in that graph, to be much more than the distance between non-MSA income and the x-axis. It's pretty misleading, honestly.
North — March 27, 2009
(And I know you mention it as a caveat; it's still misleading.)
dreikin — March 28, 2009
I found the 'by family structure' graph most interesting. All 3 of the low lines are singles, and both of the high lines are couples. But more than that, the couples per-individual still made more than the singles. I suspect part of that may be an increase in the couples:singles ratio as people get older (and better paying jobs)
Sociological Images » MY RANT ON “AMERICA’S” RECESSION — April 13, 2009
[...] more on the economy, visit these posts: increases in household debt, job loss and unemployment (here, here, here, and here), cessna responds to the attack on private [...]