

Katrin let us know about this great clip from PBS News Hour (and posted at Boing Boing) about inequality and Americans’ perceptions about how wealth is distributed in the U.S. It’s a great clip:
PBS posted the pie charts used in the video as well.
Katrin let us know about this great clip from PBS News Hour (and posted at Boing Boing) about inequality and Americans’ perceptions about how wealth is distributed in the U.S. It’s a great clip:
PBS posted the pie charts used in the video as well.
The U.S. economy is in trouble and that means trouble for the world economy.
According to a United Nations Conference on Trade and Development report, “Buoyant consumer demand in the United States was the main driver of global economic growth for many years in the run-up to the current global economic crisis.”
Before the crisis, U.S. household consumption accounted for approximately 16 percent of total global output, with imports comprising a significant share and playing a critical role in supporting growth in other countries.
…as a result of global production sharing, United States consumer spending increas[ed] global economic activities in many indirect ways as well (e.g. business investments in countries such as Germany and Japan to produce machinery for export to China and its use there for the manufacture of exports to the United States).
In short, a significant decline in U.S. spending can be expected to have a major impact on world growth, with serious blow-back for the United States.
There are those who argue that things are not so dire, that other countries are capable of stepping up their spending to compensate for any decline in U.S. consumption. However, the evidence suggests otherwise.As the chart below (from the report) reveals, consumption spending in the U.S. is far greater than in any other country; it is greater than Chinese, German, and Japanese consumption combined.

Moreover, there is little reason to believe that the Chinese, German, or Japanese governments are interested in boosting consumer spending in their respective countries. All three governments continue to pursue export-led growth strategies that are underpinned by policies designed to suppress wage growth (lower wages = cheaper goods = stronger competitiveness in international markets). Such policies restrict rather than encourage national consumption because they limit the amount of money people have to spend.
For example, China is the world’s fastest growing major economy and often viewed as a potential alternative growth pole to the United States. Yet, the Economist reveals that the country’s growth has brought few benefits to the majority of Chinese workers.

According to the U.S. Bureau of Labor Statistics, despite several years of wage increases, Chinese manufacturing workers still only earn an average of $1.36 per hour (including all benefits). In relative terms, Chinese hourly labor compensation is roughly 4 percent of that in the United States. It even remains considerably below that in Mexico.
Trends in Germany, the other high-flying major economy, are rather similar. As the chart below shows, the share of German GDP going to its workers has been declining for over a decade. It is now considerably below its 1995 level. In fact, the German government’s success in driving down German labor costs is one of the main causes of Europe’s current debt problems — other European countries have been unable to match Germany’s cost advantage, leaving them with growing trade deficits and foreign debt (largely owed to German banks).

The Japanese economy, which remains in stagnation, is definitely unable to play a significant role in supporting world growth. Moreover, as we see below, much like in the United States, China, and Germany, workers in Japan continue to produce more per hour while suffering real wage declines.

For a number of years, world growth was sustained by ever greater debt-driven U.S. consumer spending. That driver now appears exhausted and U.S. political and economic leaders are pushing hard for austerity. If they get their way, the repercussions will be serious for workers everywhere.
Our goal should not be a return to the unbalanced growth of the past but new, more stable and equitable world-wide patterns of production and consumption. Achieving that outcome will not be easy, especially since as the United Nations Conference on Trade and Development’s World Investment Report 2011 points out, transnational corporations (including their affiliates) currently account for one-fourth of global GDP.Their affiliates alone produce more than 10 percent of global GDP and one-third of world exports. And, these figures do not include the activities of many national firms that produce according to terms specified by these transnational corporations. These dominant firms have a big stake in maintaining existing structures of production and trade regardless of the social costs and they exercise considerable political influence in all the countries in which they operate.
Sangyoub Park let us know that the Bureau of Labor Statistics has released the results of the 2010 American Time Use Survey, a study that looks at what we do with our time. They haven’t released any charts of the 2010 data yet, but the Wall Street Journal posted an article with an image that summarizes the changes since 2007, before the recession began. Not surprisingly, on average Americans are spending less time working and more time sleeping and watching TV, among other activities: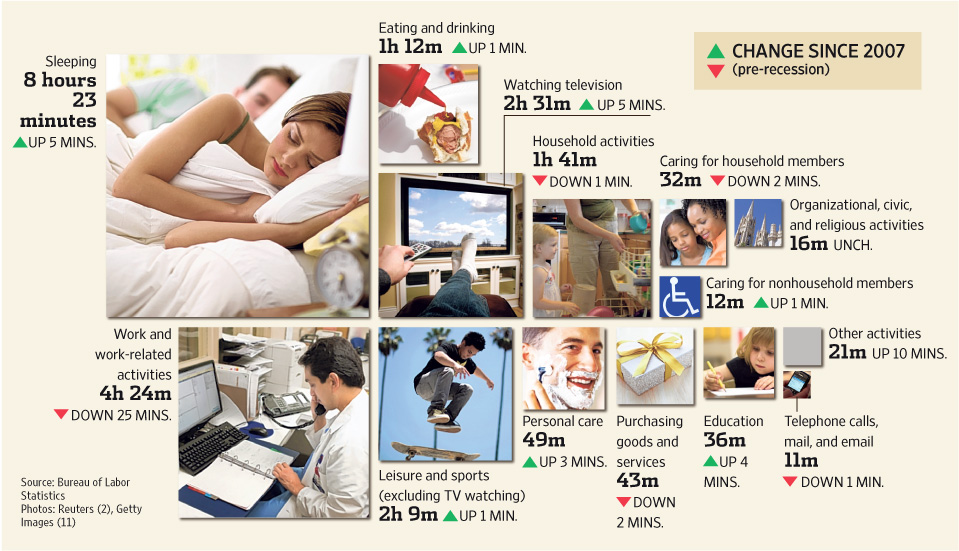
Keep in mind those numbers are daily averages that even out activity that is often not evenly distributed in real life (such as work, where weekly hours worked are averaged across all 7 days).
These changes seem insignificant when you look at them; so what if Americans are, on average, sleeping 5 extra minutes a day, or spending 2 minutes less buying things? But when aggregated across the entire U.S. population aged 15 years or older, these add up to major shifts in family and work life as well as economic activity.
There’s a video to accompany the story:
Finally, they have an interactive website where you can enter your own time use in major categories (to the best you can estimate it) and see how you compare to national averages.
We’ll follow up with more detailed posts once the BLS starts posting relevant charts.
Cross-posted at Reports from the Economic Front.
Social Security is in Danger
The recently approved deficit reduction plan includes the establishment of a Congressional super committee that is supposed to propose ways to achieve $1.2-1.5 trillion in deficit reduction over the next ten years. Everything is on the table, including Social Security. It must complete its work by November 23, 2011.
While the committee could decide to spare Social Security, the odds are great that its final proposal will include significant benefit cuts. Most Republicans have long sought to dismantle the program and President Obama is willing to accept a reduction in Social Security benefits for the sake of deficit reduction. Standard and Poor’s downgrade of the federal government’s credit rating only adds to the pressure. The rating agency explained its decision as follows:
We lowered our long-term rating on the U.S. because we believe that the prolonged controversy over raising the statutory debt ceiling and the related fiscal policy debate indicate that further near-term progress containing the growth in public spending, especially on entitlements, or on reaching an agreement on raising revenues is less likely than we previously assumed and will remain a contentious and fitful process.
Why Social Security is Important
There has been little media discussion of the importance of Social Security to those over 65. According to the Economic Policy Institute:
The average annual Social Security retirement benefit in 2009 was $13,406.40, slightly above the $10,289 federal poverty line for individuals age 65 and older, but less than the minimum wage. While modest in size, Social Security benefits comprise a substantial share of household income for most elderly recipients.
The chart below shows that the poorest 40% of households with a head 65 years or older rely on social security for more than 80% of their income. Even the middle 20% depend on social security for more than 60% of their income. In sum, cutting social security benefits will hit hard at the great majority of seniors.

How the Change Will Undermine Benefits
If the super committee does decide to go after social security, it will likely do so by proposing that social security benefits be adjusted using a new measure of inflation. Right now benefits are adjusted using the CPI-W, which measures the change in prices of goods and services commonly consumed by urban wage earners and clerical workers. The new measure is called the Chained Consumer Price Index for all Urban Consumers.
This all sounds very technical, but the basic idea is simple. The CPI-W measures the increase in the cost of a relatively fixed bundle of goods and services. The Chained Consumer Price Index assumes that consumers continually adjust their purchases, giving up those goods and services that are expensive in favor of cheaper substitutes. The chained index would produce a lower rate of inflation because the goods and services whose prices are rising the fastest would be dropped from the index or given lower weight. The result would be a smaller annual cost of living adjustment for those receiving Social Security, thereby cutting Social Security outlays.
Those who support using a chained index argue that it is a more accurate measure of inflation than the CPI-W. In reality, it just masks the fact that people are unable to buy the goods and services they once enjoyed. If we are really concerned about accuracy, we could use the CPI-E, which measures the change in prices of those goods and services commonly consumed by seniors. The CPI-E has risen much faster than the CPI-W, demonstrating that current cost of living adjustments are actually too low, not too high.
The following chart should leave no doubt as to what is at stake in this “technical” adjustment. A medium earner retiring this year at age 65 would receive $15,132. The retiree’s real (inflation adjusted) earnings would remain constant over time assuming that Social Security benefits were adjusted using the existing CPI-W. If benefits were adjusted using the proposed Chained CPI, the retiree’s real earnings would steadily decline, falling to $13,740 at age 95. By comparison, benefits would grow to $16,131 if the CPI-E were used.

Why Social Security is the Wrong Target
Social Security shouldn’t be on the cutting board at all. It is a self-financing system, one with a large surplus. Some analysts say that the system will not have sufficient funds to meet its obligations by 2037. In fact, this claim is based on very extreme and unlikely assumptions about future economic activity. But, even if we accept these assumptions, we can easily escape the predicted crisis by applying the Social Security tax to labor income above $106,800. Currently, earnings above that amount are exempt from the tax. Removing the tax ceiling would ensure the solvency of Social Security through the next 75 years.
Cross-posted at Scientopia, Ms., and Jezebel.
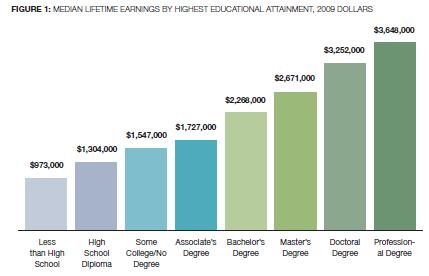
Dolores R. and Andrew S. let us know about the report “The College Payoff: Education, Occupations, Lifetime Earnings,” by researchers at Georgetown University’s Center on Education and the Workforce, based on 2007-2009 American Community Survey data (via Feministing and Kay Steiger). Not surprisingly, higher education significantly increases lifetime earnings of U.S. workers:
But education doesn’t pay off equally for all groups. Women, not surprisingly, make less at every level of education than men do; in fact, their median lifetime earnings are generally on par with men a couple of rungs down the educational ladder:
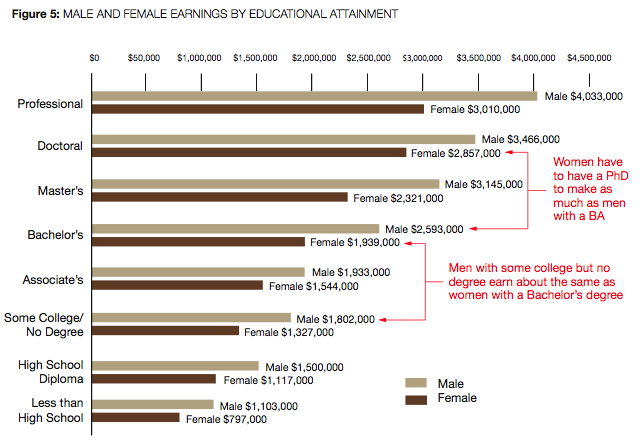
Ah, but, you might think, women are more likely to take time out of the workforce than men, so perhaps that accounts for the difference. But the gaps calculated here are only for full-time, year-round workers and do not include periods out of the workforce — that is, this is the “best-case scenario” in terms of comparing gender earnings, and yet women still make about 25% less than men at the same educational level. When they include workers taking time out of the workforce, the pay gap would be significantly larger. The far right column in this table shows how much less women make compared to men based on the “typical” work pattern for workers in each educational category:

The benefits of education also vary by race and ethnicity, with non-Hispanic Whites generally making more at each educational level than all other groups, though Asians outearn them at the highest levels:
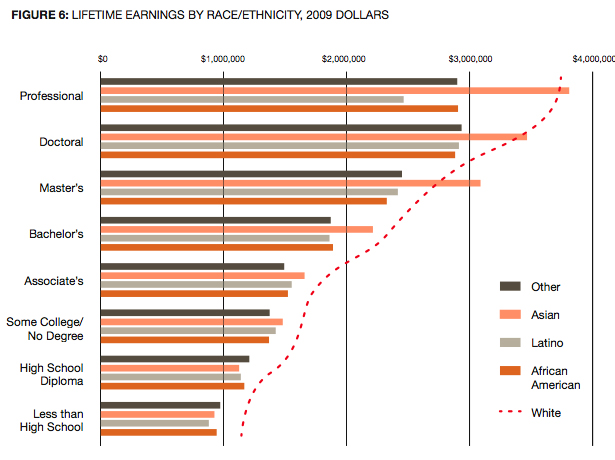
Though the authors don’t include a table showing the gap if you include workers who do not work full-time year-round throughout their careers, they state that as with gender, the gap widens significantly, since non-Whites are more likely to experience periods without work.
So does education pay? Undoubtedly, for all groups. But due to factors such as occupational segregation (especially by gender) and discrimination in the workplace, the return on an educational investment is clearly a lot higher for some than others.
Also see our recent posts on the gender gap in science and tech jobs, racial differences in job loss during the recession, unemployment among Black and White college grads, and trends in job segregation by sex.
Laura E. sent in a link to the Off the Charts blog by the Center for Budget and Policy Priorities. They posted a set of charts highlighting ongoing unemployment in the U.S. Overall, the private sector has been adding jobs, but at generally very low levels:
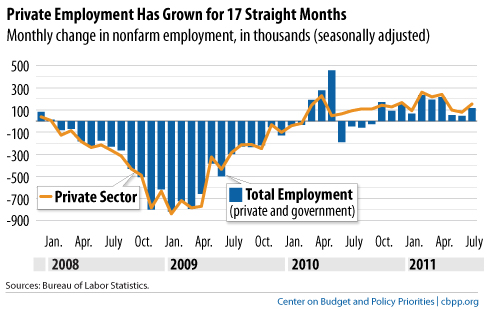
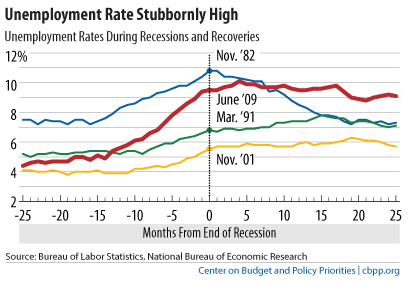
But we lost so many jobs relative to the overall working-age population during this recession that the slow job growth simply isn’t enough to significantly alter the unemployment rate, which is still hovering around 9% (though much higher for some groups, particularly young people and racial and ethnic minorities):
The increased labor force participation we saw during the 1990s and 200s have been erased:

The CBPP has a collection of recession-related charts, including this graph of the number of individuals needing a job per each available job opening, a ratio that remains quite discouraging:

In the last few days since the debt ceiling fiasco, a number of economic experts have begun discussing the possibility of a double-dip recession and, as you may have heard, last night Standard & Poor’s downgraded the U.S. debt rating. Overall, it’s not an encouraging picture of our immediate economic future.

Dmitriy T.M. sent in a video put together by the Center for Investigative Reporting about some of the hidden costs of gasoline use in the U.S.:
Also check out our earlier posts on Lisa Margonelli’s TED talk about the political economy of oil in the U.S. as well as the inconsistent relationship between gas prices and how much we drive.
Cross-posted at Scientopia.
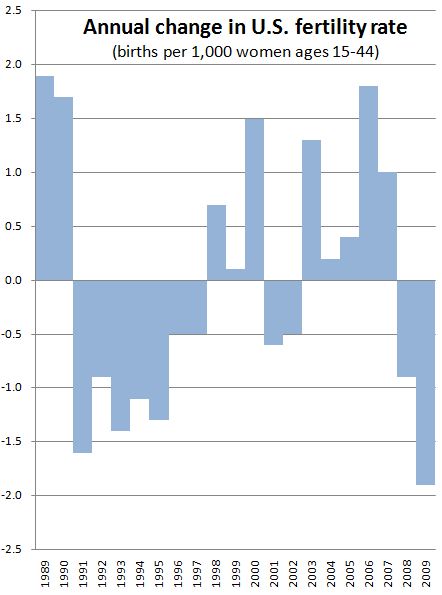
As demonstrated by some figures posted at Family Inequality, the U.S. birthrate has dropped during the recession:
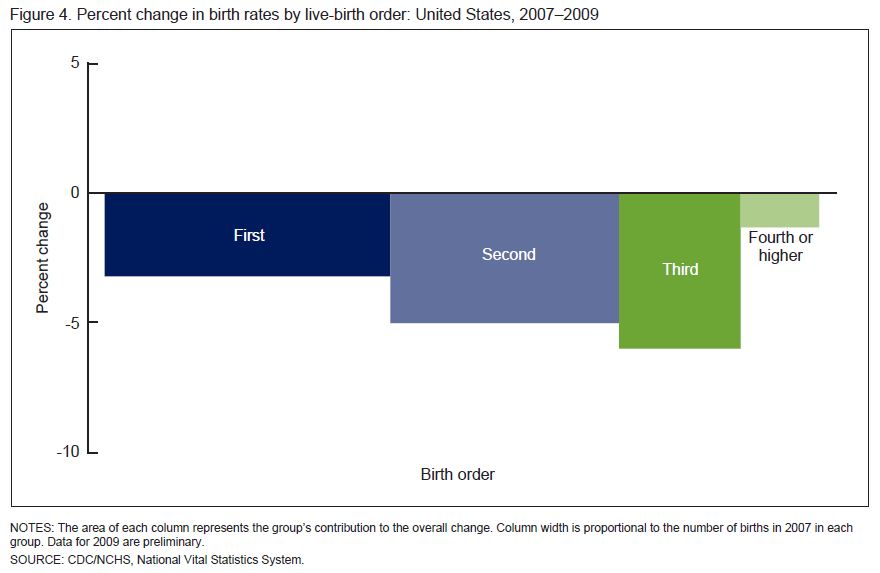
But the birth rate hasn’t dropped for all American women equally. Women who’ve already had two children were most likely to skip having a child during this period, and women who already had one child were more likely to delay or end childbearing than women with no children. But women who already had three children were relatively ready to plow forward with a fourth, even more ready than childless women.
To make an even stronger case that the recession inhibited childbearing, Philip Cohen correlated birth data by state and state unemployment rates (both from the Bureau of Labor Statistics). His figure shows that “fertility fell more where the recession hit harder”:
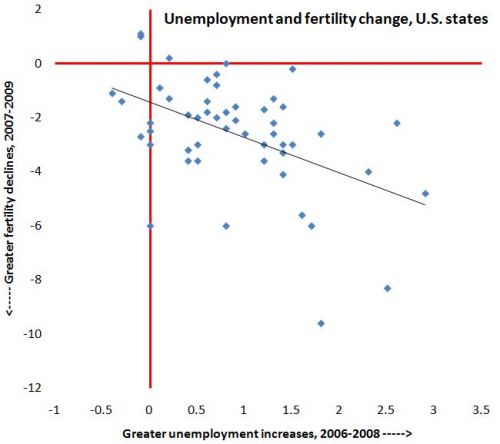
Great stuff, as always, from Family Inequality.
Lisa Wade, PhD is an Associate Professor at Tulane University. She is the author of American Hookup, a book about college sexual culture; a textbook about gender; and a forthcoming introductory text: Terrible Magnificent Sociology. You can follow her on Twitter and Instagram.