economics

The Pew Project for Excellence in Journalism reports that coverage of the economy went up in October:

Overall economic coverage accounted for 22% of the newshole from October 3-9, up from 14% the week before (when it was No. 2).

(The word “newshole” refers to the limited space/time devoted to news in a day.)

Coverage of the protests is rising too, suggesting that Occupy Wall Street can take at least part of the credit:

The protests [themselves]… constituted the largest single thread in that coverage, making up about one-third of the economic storyline. That amounted to roughly 7% of the overall newshole, or nearly four times the amount of protest coverage from the week before.


So, is Occupy Wall Street also changing the discourse?

Jeremiah sent a link to data collected by Think Progress that suggests it is.  They counted the number of times MSNBC, CNN, and Fox used the terms “unemployed,”  “unemployment,” and “debt” during the last week in July, before the protests began.  They found that news coverage emphasized the debt (and the need to cut spending to reduce it) much, much more than the fact that there were large numbers of unemployed people (who would be helped by spending).

During the week of October 10-16, though, the language was different.  News coverage talked about the protests themselves, and the problem of jobs for the unemployed. The specter of the debt is now taking a back seat to the suffering of individuals.

It’ll be interesting to see what happens.

Lisa Wade, PhD is an Associate Professor at Tulane University. She is the author of American Hookup, a book about college sexual culture; a textbook about gender; and a forthcoming introductory text: Terrible Magnificent Sociology. You can follow her on Twitter and Instagram.


A group of conservative research institutes led by W. Bradford Wilcox’s National Marriage Project, with support from the Bradley Foundation, have produced a website called The Sustainable Demographic Dividend. They argue:

…the long-term fortunes of the modern economy rise and fall with the family. The report focuses on the key roles marriage and fertility play in sustaining long-term economic growth, the viability of the welfare state, the size and quality of the workforce, and the profitability of large sectors of the modern economy.

The analysis is not important, mostly focusing on promoting religion and marriage (I wrote more about one of the articles here). But they do make a unique appeal to corporate America:

Companies whose fortunes are linked to the health of the family, such as Procter & Gamble, spend billions of dollars each year on advertising. … Executives with oversight across brands should ask themselves a simple question: Do the messages used in our advertising make family life look attractive? Or do they exalt single living? Obviously, it’s in their long-term interest to do more of the former.

And they offer as a positive example this video from Proctor & Gamble, celebrating the company’s 75th anniversary in the Philippines.

One of the essays in the report says,

A turning point has occurred in the life of the human race. The sustainability of humankind’s oldest institution, the family—the fount of fertility, nurturance, and human capital—is now an open question.

Would more of this kind of advertising help to bring back the traditional family?

Cross-posted at Montclair SocioBlog.

If your survey doesn’t find what you want it to find . . .

. . . say that it did.

Doug Schoen is a pollster who wants the Democrats to distance themselves from the Occupy Wall Street protesters.   (Schoen is Mayor Bloomberg’s pollster.  He has also worked for Bill Clinton.)  In the Wall Street Journal,  he reported on a survey done by a researcher at his firm.  She interviewed 200 of the protesters in Zucotti Park.

Here is Schoen’s overall take:

What binds a large majority of the protesters together—regardless of age, socioeconomic status or education—is a deep commitment to left-wing policies: opposition to free-market capitalism and support for radical redistribution of wealth, intense regulation of the private sector, and protectionist policies to keep American jobs from going overseas.

I suppose it’s nitpicking to point out that the survey did not ask about SES or education.  Even if it had, breaking the 200 respondents down into these categories would give numbers too small for comparison.

More to the point, that “large majority” opposed to free-market capitalism is 4% — eight of the people interviewed.  Another eight said they wanted “radical redistribution of wealth.”  So at most, 16 people, 8%, mentioned these goals.  (The full results of the survey are available here.)

What would you like to see the Occupy Wall Street movement achieve? {Open Ended}

35% Influence the Democratic Party the way the Tea Party has influenced the GOP
4% Radical redistribution of wealth
5% Overhaul of tax system: replace income tax with flat tax
7% Direct Democracy
9% Engage & mobilize Progressives
9% Promote a national conversation
11% Break the two-party duopoly
4% Dissolution of our representative democracy/capitalist system
4% Single payer health care
4% Pull out of Afghanistan immediately
8% Not sure

Schoen’s distortion reminded me of this photo that I took on Saturday (it was our semi-annual Sociology New York Walk, and Zucotti Park was our first stop).

The big poster in the foreground, the one that captures your attention, is radical militance — the waif from the “Les Mis” poster turned revolutionary.  But the specific points on the sign at the right are conventional liberal policies — the policies of the current Administration.

There are other ways to misinterpret survey results.  Here is Schoen in the WSJ:

Sixty-five percent say that government has a moral responsibility to guarantee all citizens access to affordable health care, a college education, and a secure retirement—no matter the cost.

Here is the actual question:

Do you agree or disagree with the following statement: Government has a moral responsibility to guarantee healthcare, college education, and a secure retirement for all.

“No matter the cost” is not in the question.  As careful survey researchers know, even slight changes in wording can affect responses.  And including or omitting “no matter the cost” is hardly a slight change.

As evidence for the extreme radicalism of the protestors, Schoen says,

By a large margin (77%-22%), they support raising taxes on the wealthiest Americans,

Schoen doesn’t bother to mention that this isn’t much different from what you’d find outside Zucotti Park.  Recent polls by Pew and Gallup find support for increased taxes on the wealthy ($250,000 or more) at 67%.  (Given the small sample size of the Zucotti poll, 67% may be within the margin of error.)  Gallup also finds the majorities of two-thirds or more think that banks, large corporations, and lobbyists have too much power.

Thus Occupy Wall Street is a group of engaged progressives who are disillusioned with the capitalist system and have a distinct activist orientation. . . . .Half (52%) have participated in a political movement before.

That means that half the protesters were never politically active until Occupy Wall Street inspired them.

Reading Schoen, you get the impression that these are hard-core activists, old hands at political demonstrations, with Phil Ochs on their iPods and a well-thumbed copy of “The Manifesto” in their pockets.  In fact, the protesters were mostly young people with not much political experience who wanted to work within the system (i.e., with the Democratic party) to achieve fairly conventional goals, like keeping the financial industry from driving the economy into a ditch again.

And according to a recent Time survey, more than half of America views them favorably.

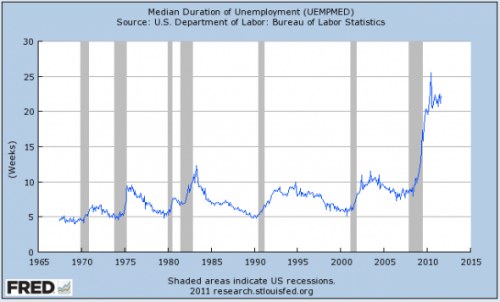
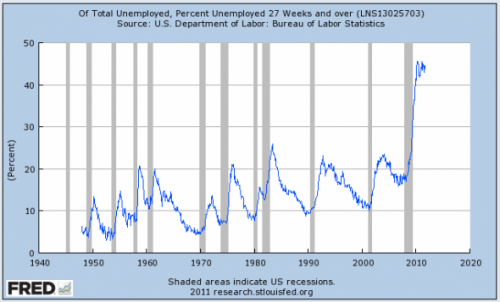
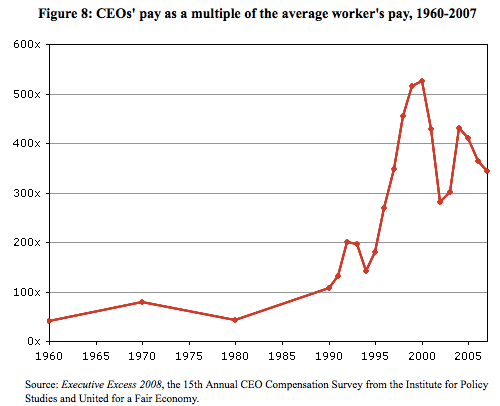
Shamus Khan posted a link to a great slideshow put together by the Business Insider that summarizes the current state of our economy. It’s a one-stop illustration of, in their words, “What the Wall Street protestors are so angry about,” and definitely worthy of clicking over to see the whole thing. I’m posting just a few of the images here.

The median length of unemployment for those who lose their jobs is now over 20 weeks:

About 45% of the currently unemployed have been without a job for at least 27 weeks — six to seven months without a job:

CEO pay is now roughly 350 times higher than the average worker’s:

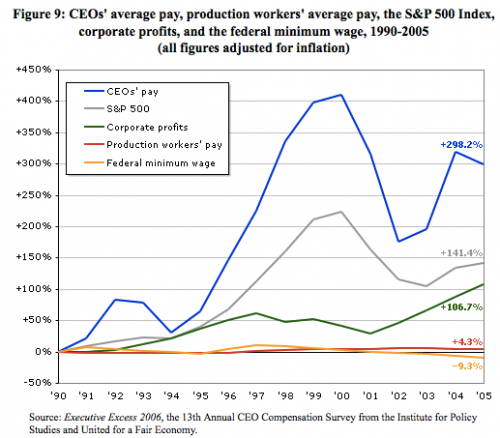
And CEO pay has grown dramatically since the early ’90s, though production workers’ pay has barely budged and the minimum wage has actually dropped if you adjust for inflation:

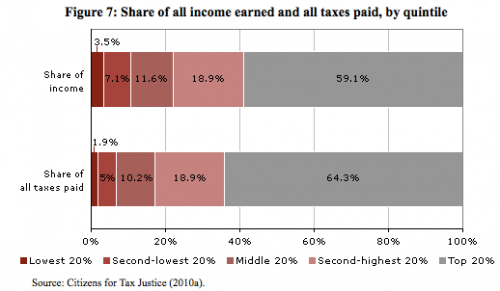
We often hear that the extremely wealthy pay a very disproportionate amount of U.S. taxes. It is true that they pay a large share. But it’s not so imbalanced compared to how much of all income they earn. For instance, the richest 20% of earners receive 59.1% of all U.S. income but pay 64.3% of taxes:

There’s much, much more in the full slideshow; go check it out.

An April 2011 Gallup poll found that 29% of Americans thought that the U.S. economy was in a depression.  Another 26% thought it was only a recession.   This is scary since, according to the National Bureau of Economic Research, we have been in an economic expansion since June 2009.

Why would so many Americans feel this way you might ask.  Here is one reason.  According to recent Census Bureau data, during the recession, which lasted from December 2007 to June 2009, inflation-adjusted median household income fell by 3.2%.  Between June 2009 and June 2011, a period of economic expansion, inflation-adjusted median household income fell by 6.7%.   This decline is illustrated in the New York Times chart below.

1010-nat-incomeweb.jpg

I recently appeared on the Alliance for Democracy’s “Populist Dialogue” TV show to talk about our economic crisis and possible responses to it.  You can watch the show here or below.

Children are our most important resource.  Everyone says it, but we don’t really mean it.

Exhibit one: the percentage of children under the age of 18 that live in poverty. In 2007, at the peak of our previous economic expansion, the child poverty rate was 18%.  In 2009, it hit 20%.  The figure below provides a look at child poverty rates in each state.  New Hampshire had the lowest rate: 11%.  Mississippi the highest rate: 31%. According to a recently released Census Bureau study, the 2010 national child poverty rate was 22%.


poverty.jpg


How Do We Measure Poverty?

Children under the age of 18 are counted as poor if they live in families with income below U.S. poverty thresholds.  There are a range of poverty thresholds which are based on family size and number of children.  These poverty thresholds are far from generous.  The 2009 poverty threshold for a family of two adults and two children was$21,756.

Sadly our poverty rates understate the seriousness of our poverty problem, for children and adults.  The history of how we developed and calculate our official poverty thresholds provides perhaps the clearest proof of the inadequacy of current statistics.  First introduced in 1965, the thresholds were based on previous work by the Department of Agriculture (DOA).  The DOA created an “economy” food plan in the 1950s that was designed for “temporary or emergency use when funds are low.”  DOA surveys had also established that families of three or more persons spent approximately one-third of their after tax income on food.  Our initial thresholds were set by multiplying the cost of the economy food plan (adjusted for family size) by three.

From 1966 to 1969, these poverty thresholds were revised annually by the yearly change in the cost of the items contained in the economy food plan.  After 1969, and still today, the poverty thresholds were adjusted by the rise in the consumer price index.

Our poverty rates are calculated by comparing pre-tax family incomes to these thresholds.

Why the Poverty Threshold is Deficient

This methodology has produced a poverty standard and estimates of poverty that are deficient for several important reasons:

First, our knowledge of nutrition has significantly changed since the 1950s.

Second, families now spend approximately one-fifth of their after-tax income on food, not one-third.  That correction alone would mean that the food budget should be multiplied by 5 rather than 3, thereby producing higher thresholds and poverty rates.

Third, poverty is best thought of as a relative condition, which means that it should not be measured by comparing incomes to an unchanging standard based on the cost of a 1950’s economy food plan.

Fourth, poverty rates should be calculated using after-tax family income adjusted to include the value of government support programs like food stamps (which are also fluctuating and often cut in hard times), not unadjusted pre-tax family income.

A Better Measure

Researchers, drawing on the work of the National Academy of Sciences Panel on Poverty and Family Assistance Economists, have developed an alternative experimental approach to measuring poverty.  They start with a reference family, two adults and two children.  Then, using Consumer Expenditure Surveys, they calculate the dollar amount of spending on food, clothing, shelter, utilities and medical care by all reference families in a given year.

The poverty threshold for the reference family is set at the midpoint between the 30th and 35th percentile of the spending distribution for all families with two adults and two children.  Small multipliers are then used to add spending estimates for other needs, such as transportation and personal care, slightly raising the poverty threshold.   This threshold is adjusted for families of other compositions.

The chart below shows national poverty rates for the years 1996 to 2005.  We see that the rates produced by this experimental methodology are significantly higher than the official rates.

comparison.jpg

Strikingly, while the official poverty rate is lower in 2005 than in 1996, the 2005 experimental poverty rate is the highest in the period.  The difference is largely explained by the fact that the experimental measure incorporates changes in the availability of social programs and the relative importance of non-food goods and services in family spending.

Returning to the issue of child poverty, the table below highlights the difference between the two measures for specific demographic groups.  Notice that the child poverty rate calculated using the experimental measure is always higher than the official rate.  As previously stated, the official 2010 child poverty rate is 22 percent.  The experimental rate would no doubt be several percentage points higher, closing in on 25 percent.

poverty-table.jpg

What can one say about a situation where between one-fifth and one-fourth of all children in the United States live in poverty?  Language like “outrageous,” “unacceptable,” and “indicator of a flawed economic system” comes to mind.  What also comes to mind is the fact that these poverty statistics rarely get the attention they deserve, as does the question of why that is so.

This week I listened to a Freakonomics podcast featuring Economics PhD-student twins, Alison and Steve Sexton.  They had studied the phenomenon of conspicuous conservation, which I’ve defined elsewhere as “the (often lavish) spending on ‘green’ products designed mainly to advertise one’s environmentally-moral righteousness.”  The Sexton’s studied how much people are willing to pay for the conspiciousness of their conservation.

They found that, in places where being environmentally-friendly is looked upon positively, people will spend more (or gain less) to ensure that their conservation efforts are obvious. For example, people will sometimes have their solar panels mounted on the shady side of their house. Why? It’s the side that faces the street. Why have solar panels if no one in the neighborhood can see that you do?  Likewise, the Prius is so popular in part because it is obviously a hybrid; no other car looks like it, so it can’t be mistaken for a “regular” (person’s) car.

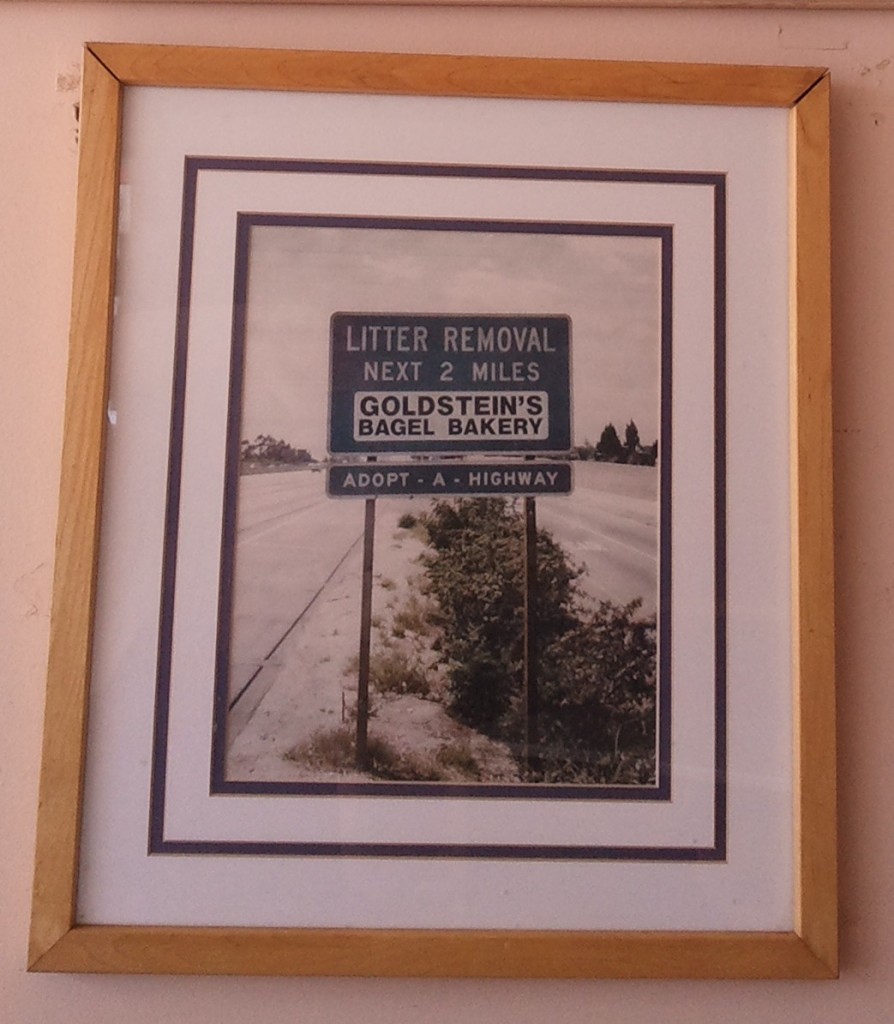
I thought of this willingness to pay to display one’s environmental thoughtfulness while visiting Goldstein’s Bagels in La Cañada, CA this week. They had this photograph proudly displayed:

I just love how not only are they paying to keep the highway clean, they’re being rewarded with a big advertisement for their store alongside the freeway, AND they get to take a picture of that sign and put it up for all to see.  It’s win-win-win; a win for the environment and a double win for Goldstein’s.

The Sexton’s argue that all of this conspicuous conservation is probably good.  Competing to be environmentally-friendly translates into more conservation, no matter what the motivation. (Especially as compared to conspicuous consumption; remember the Hummer?)  Accordingly, they suggest that public policy should focus on incentivizing the types of conservation efforts that aren’t visible, like insulation and weather-proofed windows, and leave the showy stuff to the market.

For another example of conspicuous conservation, see our post on faux-oil slicked shoes purchased to benefit the Gulf; on conspicuous consumption, check out the Louis Vitton mommy diva birthday cake; and see this post on conspicuous intellectual consumption.

Lisa Wade, PhD is an Associate Professor at Tulane University. She is the author of American Hookup, a book about college sexual culture; a textbook about gender; and a forthcoming introductory text: Terrible Magnificent Sociology. You can follow her on Twitter and Instagram.


The media likes to talk about markets as if they were just a force of nature.  In fact, markets and their outcomes are largely shaped by political power.  In a capitalist system like ours, that power is largely used to advance the interests of those who own and run our dominant corporations.

Thanks to Bloomberg News we have yet another example of this reality.  In brief, as a result of Congressional and media pressure the Federal Reserve was recently forced to reveal its lending activity for the period August 2007 through April 2010.   Bloomberg News examined these Federal Reserve records and found that the Fed secretly provided selected banks, brokerage houses, and even non-financial firms (such as General Electric and Ford) with at least $1.2 trillion in loans, often with minimal collateral required and at below market interest rates.

This money was given through more than a dozen lending programs.  Many firms tapped multiple programs through multiple subsidiaries. Bloomberg arrived at its total by focusing on the seven largest programs, which included the Fed’s discount window and six temporary lending facilities (the Asset-Backed Commercial Paper Money Market Mutual Fund Liquidity Facility; the Commercial Paper Funding Facility; the Primary Dealer Credit Facility; the Term Auction Facility; the Term Securities Lending Facility; and so-called single- tranche open market operations).

If you like visuals, here is a 5 minute video that provides a good summary of what Bloomberg gleaned from its examination.

UPDATE: Embedding was disabled, but you can watch it here.

Bloomberg also has an interactive site that allows you to chart who got what and over what period.

Some of the highlights are as follows:

The largest borrower, Morgan Stanley, got as much as $107.3 billion, while Citigroup took $99.5 billion and Bank of America $91.4 billion . . .

Almost half of the Fed’s top 30 borrowers, measured by peak balances, were European firms. They included Edinburgh-based Royal Bank of Scotland, which took $84.5 billion, the most of any non-U.S. lender, and Zurich-based UBS AG, which got $77.2 billion. . . .

The $1.2 trillion peak on Dec. 5, 2008 — the combined outstanding balance under the seven programs tallied by Bloomberg — was almost three times the size of the U.S. federal budget deficit that year and more than the total earnings of all federally insured banks in the U.S. for the decade through 2010, according to data compiled by Bloomberg.

The Federal Reserve fiercely resisted making its records public, arguing that doing so would stigmatize those institutions that received loans.  A group of the largest commercial banks actually petitioned the Supreme Court in an unsuccessful effort to keep the loan information secret.

Perhaps one reason that the Federal Reserve and the banks were reluctant to have these records made public is that they raise significant questions of conflict of interest.  According to a statement by Vermont Senator Bernie Sanders:

…the Fed provided conflict of interest waivers to employees and private contractors so they could keep investments in the same financial institutions and corporations that were given emergency loans.

For example, the CEO of JP Morgan Chase served on the New York Fed’s board of directors at the same time that his bank received more than $390 billion in financial assistance from the Fed.  Moreover, JP Morgan Chase served as one of the clearing banks for the Fed’s emergency lending programs.

In another disturbing finding, the GAO said that on Sept. 19, 2008, William Dudley, who is now the New York Fed president, was granted a waiver to let him keep investments in AIG and General Electric at the same time AIG and GE were given bailout funds.  One reason the Fed did not make Dudley sell his holdings, according to the audit, was that it might have created the appearance of a conflict of interest.

Another reason may be that the Federal Reserve didn’t want it known that it was deviating from its past practice of requiring borrowers to provide secure collateral, which was normally either Treasuries or corporate bonds with the highest credit rating, and never stocks.  For example:

Morgan Stanley borrowed $61.3 billion from one Fed program in September 2008, pledging a total of $66.5 billion of collateral, according to Fed documents. Securities pledged included $21.5 billion of stocks, $6.68 billion of bonds with a junk credit rating and $19.5 billion of assets with an “unknown rating,” according to the documents. About 25 percent of the collateral was foreign-denominated.

Moreover, as Bloomberg News also reported, many Fed loans were made at below market interest.

On Oct. 20, 2008, for example, the central bank agreed to make $113.3 billion of 28-day loans through its Term Auction Facility at a rate of 1.1 percent, according to a press release at the time.

The rate was less than a third of the 3.8 percent that banks were charging each other to make one-month loans on that day. Bank of America and Wachovia Corp. each got $15 billion of the 1.1 percent TAF loans, followed by Royal Bank of Scotland’s RBS Citizens NA unit with $10 billion, Fed data show.

These loans were absolutely critical to the survival of our leading companies.  A case in point:

Citigroup was in debt to the Fed on seven out of every 10 days from August 2007 through April 2010, the most frequent U.S. borrower among the 100 biggest publicly traded firms by pre- crisis market valuation. On average, the bank had a daily balance at the Fed of almost $20 billion.

These loans are also a key reason that our post-Great Recession economy remains largely unchanged in structure.  In other words, it was the exercise of political power, rather than so-called market dynamics or efficiencies, that explains the financial industry’s continuing profitability and economic dominance.

Now imagine if we had a state that engaged in transparent planning and was committed to using our significant public resources to reshape our economy in the public interest.  As we have seen, state planning and intervention in economic activity already goes on.  Unfortunately, it happens behind closed doors and for the benefit of a small minority. It doesn’t have to be that way.