
Cross-posted at Scientopia.
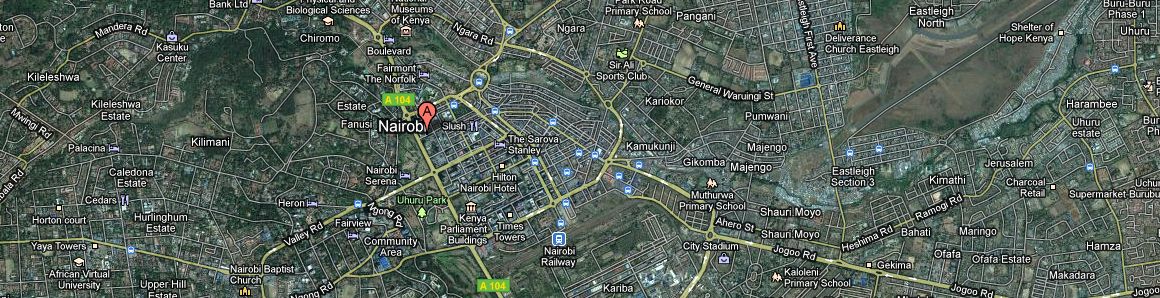
Sadie M. sent in an example of the reproduction of the idea that “Africa” is an arid, desolate place where nature still dominates civilization. The snapshot Sadie sent in was of Nairobi. Nairobi is the 12th largest city on the continent of Africa with a population of over 3 million in the city and its surrounding suburbs. It is the capital of Kenya and an economic, political, and financial hub in the region.
This is Nairobi on Google maps:
This is what comes up if you Google image Nairobi:
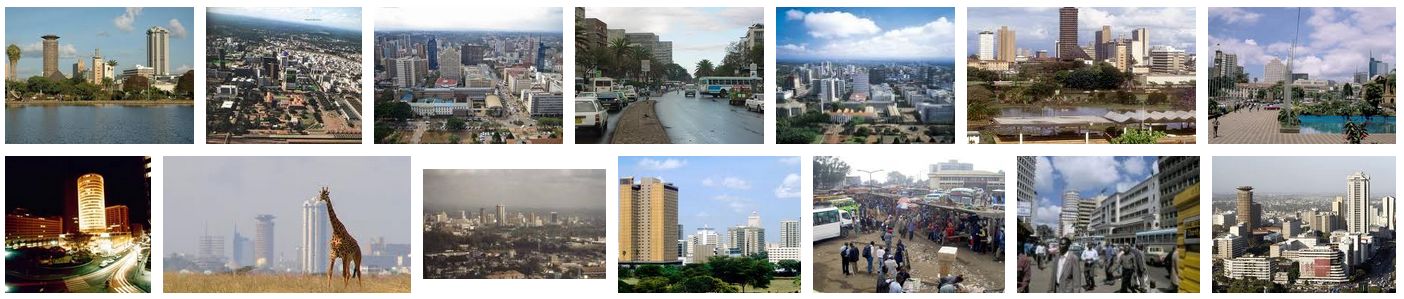
Nairobi is also not a desert plain. The name, in Maasai, translates into “the place of cool waters” and it is popularly known as “Green City in the Sun” (wikipedia).
Despite all of this, Sadie’s snapshot shows that an in flight magazine depicted Nairobi as a savanna full of elephants and bereft of people. The other two destinations featured — New York and Sydney — are pictured as they are.
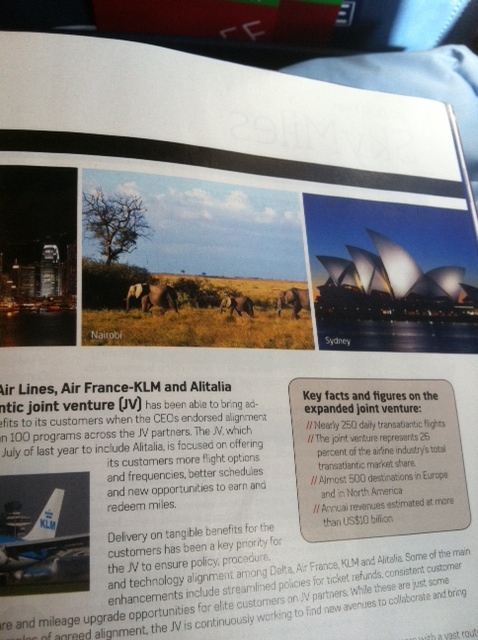
So there we have it: Another piece of advertising erasing the bustling, successful economies of Africa, and instead reproducing the idea that the entire continent is an uncivilized desert full of exotic animals.
See also: How Not to Write about Africa and The Single Story of “Africa.”
Lisa Wade, PhD is an Associate Professor at Tulane University. She is the author of American Hookup, a book about college sexual culture; a textbook about gender; and a forthcoming introductory text: Terrible Magnificent Sociology. You can follow her on Twitter and Instagram.


