race/ethnicity: Whites/Europeans

Dmitriy T.M. sent in a link to an interesting breakdown of the race/ethnicity and gender of guests on a number of late-night talk shows, found at Edlundart.

Edlund explains the methodology:

The data for this graphic was gathered over 6 weeks in August and September of 2010. Numbers are based on guest lists as presented on Late Night Lineups. Determining race/ethnicity can be a rather dicey and imprecise activity, and it’s also worth noting that the relationship between census and guest numbers is not a pure one – for example, some of the guests I counted as white are British white people who are visiting the United States.

Of course, a few guests were neither White, Hispanic, Black, nor Asian. These guests were left out, as their numbers were insignificant on the whole…

Edlund also points out that since The Daily Show only has one guest per night, it has a much smaller dataset than the others, so the lack of diversity may be somewhat overstated due to such a small sample.

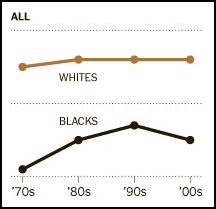
Here are the results for race (presented as % of all guests); the small dots show the percent in the Census, the wider bars the percent on the show:

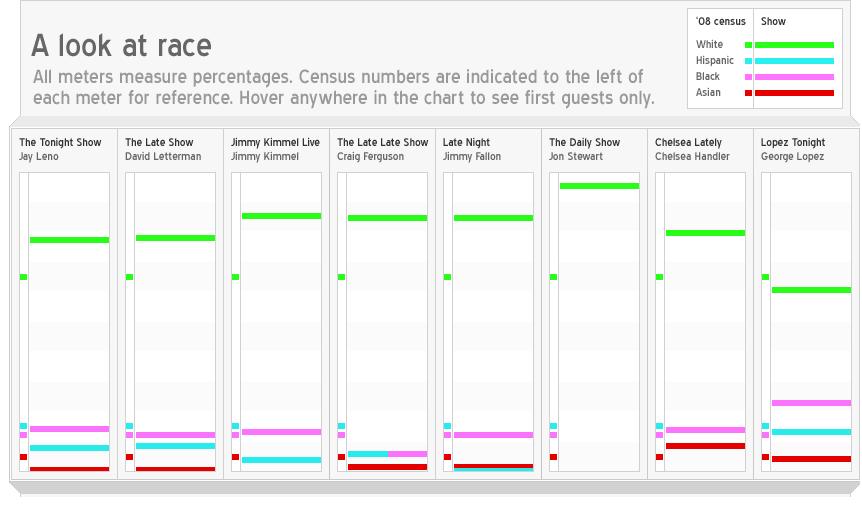
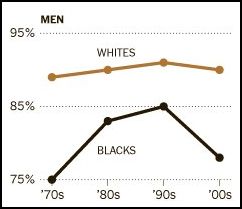
Here is the same data but for the top-billed guests only, where the over-representation of Whites goes up even more for most of the shows:

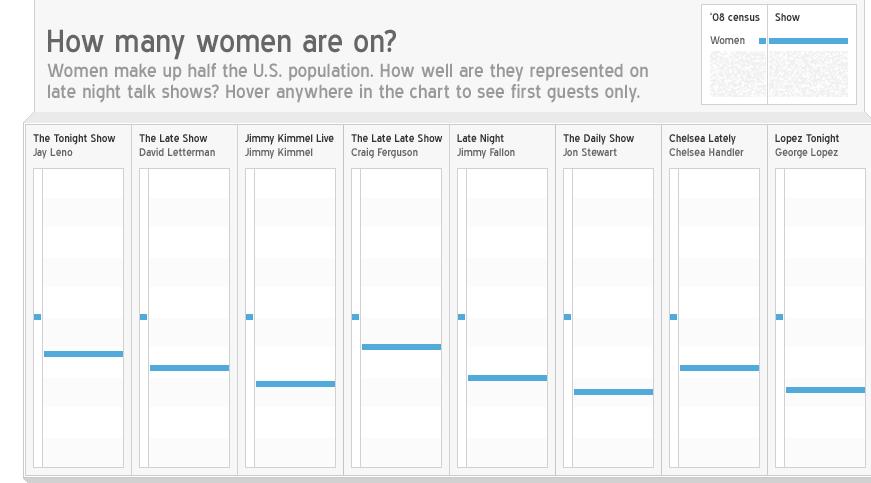
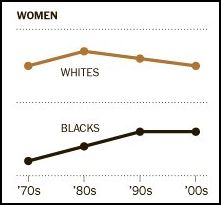
Here’s equivalent data for women:

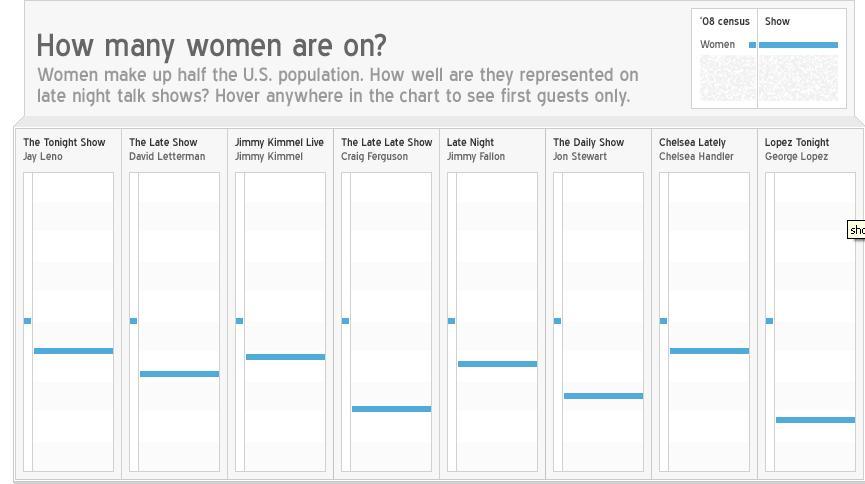
And, again, for just top-billed guests:

As Edlund says, these data both reflect and reinforce broader cultural patterns. Given that Whites still dominate the political system, for instance, it’s not surprising that political guests would be disproportionately White; and if more movies have male stars than female stars, guest spots will reflect that as well. But at the same time, these shows include people from a range of industries/careers, and their selection of guests helps raise the profile of some individuals more than others, potentially contributing to more opportunities and star power for them. So they don’t just reflect existing realities; they amplify them.

It would be great to get more info on how an individual is selected when there are multiple possibilities — say, you have a movie with several prominent cast members. In that case, are there patterns related to race/ethnicity and gender in which person is most likely to get booked?

According to a story on NPR, Asian Americans are less likely to be unemployed than White, Black, and Hispanic Americans.  But, when they do lose a job, they remain unemployed significantly longer.

Jobless Rates by Race:

Length of Unemployment:

Why might Asians have a more difficult time finding work?  Kent Wong of  UCLA’s Center for Labor Research and Education explains that their extended length of unemployment can be attributed to a confluence of two realities that make their situation unique.  First,about 70% of Asian Americans are foreign born and these immigrants often live in ethnic enclaves (e.g., Chinatowns) that focus on a single industry.  So long as there is work in that industry, Asians can find work.  But, if that industry goes south, their limited network outside of those enclaves becomes a hindrance.  Meanwhile, Asians (unlike Whites, Hispanics, and Blacks) tend to be segregated by language.  Wong explains that, with about a dozen languages spoken widely in the Asian American community, pan-ethnic networks can be difficult to build and maintain.  This leads to extra difficulty finding a new job:

If you have a Vietnamese employee working for a Vietnamese employer in Little Saigon in Orange County, that does not transfer to an ability to get a job in Koreatown in Los Angeles…

Both residential and linguistic segregation, then, contribute to long periods of unemployment for Asian Americans.

Lisa Wade, PhD is an Associate Professor at Tulane University. She is the author of American Hookup, a book about college sexual culture; a textbook about gender; and a forthcoming introductory text: Terrible Magnificent Sociology. You can follow her on Twitter and Instagram.

In this video sociologist Devah Pager describes her experimental research on race, criminal records, and employment with Dalton Conley.  Using matched pairs of black and white students posing as job applicants, she finds, stunningly, that black men without a criminal record are as likely to get a call back for a job as white men with one (see the tables here).  Black men with criminal records receive call backs for only about one in 20 completed job applications.

See also our post in which one man explains the “hidden life sentence” he received after a crime 20 years past.

Lisa Wade, PhD is an Associate Professor at Tulane University. She is the author of American Hookup, a book about college sexual culture; a textbook about gender; and a forthcoming introductory text: Terrible Magnificent Sociology. You can follow her on Twitter and Instagram.

History isn’t fact, but a narrative.  Nations narrate their own histories, telling the stories about themselves that they prefer.  Holidays are one way in which these stories are told and re-told.

At www.america.gov, the U.S. government describes Columbus Day as a”commemoration” of Columbus’ “landing in the New World” (they astutely avoid the term “discovery”) and initiating a “lasting encounter” between the mis-named “Indians” and Europeans (no mention of genocide or the stealing of land).

Contesting this particular version of history, an organization calling itself Reconsider Columbus Day is asking Americans to adopt an alternative national narrative, one that both acknowledges and emphasizes the oppressive and unjust outcomes of the ongoing “lasting encounter” between American “Indians” and Europeans-now-Americans.

The narrative and counter-narrative is an interesting example of how nation-founding memories are not set, but always potentially changing as the national ethos and distribution of power shifts underneath them.

For more on national memories, see our post comparing the German approach to the Holocaust and the America approach to slavery.

Lisa Wade, PhD is an Associate Professor at Tulane University. She is the author of American Hookup, a book about college sexual culture; a textbook about gender; and a forthcoming introductory text: Terrible Magnificent Sociology. You can follow her on Twitter and Instagram.

We know that U.S. stereotypes associate black people, especially black men, with criminality (for examples, see our posts on who looks suspicious, racial profiling, and race-sensitive trigger fingers).  But a new study by sociologists Aliya Saperstein and Andrew Penner shows that being convicted of a crime sometimes shifts people’s racial self-perceptions in related directions.  Saperstein and Penner compared the self-identification of people in 1979 and 2002.  Reflecting the social construction of race, it is typical for there to be some mis-matches between people’s reported race at different times; but the researchers discovered that the experience of being incarcerated shaped if and how one’s racial identification changed.

The Table below compares the self-reported race in 1979 (far left column) with the self reported race in 2002 (next left column).  The third and fourth columns show the reported race of people in 2002 who were not incarcerated and incarcerated, respectively.  We see that, among people who were not incarcerated, 5% of the people who identified as “European” in 1979 identified as “Black” or some other race in 2002.  Among people who were incarcerated, however, we see a much greater defection from whiteness; only 81% of those who identified as white in 1979 still did so in 2002.

Saperstein and Penner argue that this shows that “…penal institutions play an important role in racializing Americans…”  The experience of being incarcerated somehow makes people, even people who feel white, feel somehow less white.

Via Contexts Discoveries.  For great examples of the social construction of race, start with this simple lesson, then see these great posts: black and white twins! wha’!?, Obama looks just like his white grandfather, history and race in the U.S. census, claiming whiteness in court, judging racial phenotypes in China, and figuring out “Creole”.

Lisa Wade, PhD is an Associate Professor at Tulane University. She is the author of American Hookup, a book about college sexual culture; a textbook about gender; and a forthcoming introductory text: Terrible Magnificent Sociology. You can follow her on Twitter and Instagram.

As you may have heard, this week the Republican Party released what they’ve termed a “Pledge to America,” a document that lists their agenda for the next legislative session. Erin Echols, a student at Kennesaw State U., took a look at it and was struck by the contents, particularly the images.

Of the 48 total pages of the document, 14 consist of images, either a single one or a collage of several. Of course, in a document of this sort, you’re going to have the required patriotic images — the Statue of Liberty, Mount Rushmore, the Capitol and other buildings in D.C. Nothing surprising there. But Erin points out that the cowboy seems to be a recurring theme.

It reminded me of a post by Macon D. over at Racialicious a while back about some ads by a Republican primary candidate for Agricultural  Commissioner in Alabama:

The hat, the horse, the rifle, the sweeping music that makes me think of old Western movies… it all evokes what Macon D. calls the “Independent (White) Cowboy Myth,” a version of rugged, stand-alone, honest manhood. Macon D. quotes Mel at BroadSnark:

In this mythology, the cowboy is a white man. He is a crusty frontiersman taming the west and paving the way for civilization. He is the good guy fighting the dangerous Indian. He is free and independent. He is in charge of his own destiny.

Here’s the follow-up ad he made after losing:

And, for the record, I’m not arguing this presentation of Dale Peterson is necessarily fake; for all I know he dresses and acts like that all the time. People do; I’m related to some of them. I’m not saying Peterson is a fraud who really wears tuxes and has never been on a horse. That’s irrelevant. What I’m interested in is the power of a particular cowboy mythology, the one on display in Peterson’s ads.

As Macon D. points out, Ronald Reagan actively appropriated the cowboy persona, often wearing cowboy hats and jeans, sometimes alongside a horse (he had also played cowboys in a couple of movies). He openly identified with the “Sagebrush Rebellion,” an effort by groups in the western U.S. in the ’70s and ’80s to stop designation of federal lands as protected wilderness areas, push for more mining and livestock grazing rights on public land, and oppose some other environmental and land use regulations, depicted as impositions from distant elites.

Macon D. quotes Sarah Watts on the appeal of the White cowboy myth when Theodore Roosevelt first used it:

…he met the psychological desires in their imagination, making them into masters of their own fate, propelling them into violent adventure and comradeship, believing them at home in nature, not in the hothouse interiors of office buildings or middle-class homes.

The cowboy myth, then, arose partly to allay deep anxieties about changes in American society. But the myth is just that — a myth, a romanticized notion largely unmoored from the realities of cowboys’ lives. Mel says,

Cowboys were itinerant workers who, while paid fairly well when they had work, spent much of the year begging for odd jobs.  Many did not even own the horse they rode.  Frequently, they worked for large cattle companies owned by stockholders from the Northeast and Europe, not for small family operations (a la Bonanza).  The few times cowboys tried to organize, they were brutally oppressed by ranchers.

This isn’t true just in the past. I know people who work as hired hands on ranches now. They love many aspects of the life. But most of them aren’t particularly well-paid; they don’t have retirement benefits or health insurance; they aren’t on a path to being able to buy their own ranch and be a self-reliant family farmer. Some become managers, with more responsibility and money, as in any occupation. But sometimes what initially seemed like a great deal — getting free housing as part of the job — turns out to have downsides, such as being expected to be available round-the-clock since you’re right there on the property, or fearing that if you piss off your employer and get fired, you’re out of a place to live immediately as well.

The examples I’ve given here have all been Republicans. Democrats use the cowboy mythology as well — Secretary of the Interior Ken Salazar is well known for often appearing in a cowboy hat and nearly always wearing a bolo tie rather than a necktie. However, Republicans seem to appropriate the cowboy persona more often, or at least more successfully.

Anyway…back to Erin’s analysis of the “Pledge to America.” The other interesting feature of the images is their overwhelming Whiteness. Some examples of group photos:

Overall, the photos show a sea of Whiteness. As Erin says, whether it’s an unintentional oversight or a calculated choice, the resulting message is that America’s citizens, the hard-working, patriotic folks who matter and to whom the party is making pledges, are White. Given the current racialized tone of much of our political debate (especially regarding Hispanic immigrants and Muslims, a racialized group often conflated with “Arabs”), it’s a portrait of America that is likely to speak to, and soothe, the fears of some groups more than others.

Gwen Sharp is an associate professor of sociology at Nevada State College. You can follow her on Twitter at @gwensharpnv.

Rachel F. sent in a link to a site sponsored by the National Center for Culturally Responsive Educational Systems that provides a lot of information on rates of children diagnosed as in need of special education services, broken down by race. For instance, this map shows the proportion of African-Americans aged 6-21 who qualified for special ed services in 2006-2007 for all disabilities (you can also select a specific disability). The states are arranged into quintiles (so each color includes 20% of the states):

I always prefer to know the exact percentages, so I clicked on the Tables tab at the top of the page and looked at the Special Education Rates by Race and Disability link. Here are the percentages for the map above (just the first page of the table):

Here’s the equivalent data for Whites (again, page 1 of the table):

The site also provides info on teacher certification (look under the Tables tab). Here’s page 1 of a table of the states ranked by the % of special-ed teachers who are not fully certified in special education:

If you go to the map and click on a state, you can get the trend in certification over time. This shows special ed teachers who aren’t fully certified in California:

Of course, there are all sorts of interesting questions about special ed that this data set doesn’t address. The evidence is pretty clear that boys are more likely to be diagnosed as having a learning disability than girls are, and some critics suggest that behavioral issues like acting up and causing teachers headaches are becoming the basis of a diagnosis that can have life-long consequences for teachers’, parents’ and students’ expectations about how they’ll do in school. Insofar as perceptions of behavior are affected by a student’s race (see Ann Ferguson’s Bad Boys: Public Schools in the Making of Black Masculinity), this could have particularly negative consequences for some groups.

Interpreting rates of use of special ed programs is hard, too. Does the fact that Black kids in Iowa have much higher rates of qualifying for special ed courses than Black kids in Mississippi do mean that there are more disabilities in Iowa? Or that kids there benefit from better screening to identify kids who might benefit from the classes?

Aside from that, thoughts on what might be causing the dramatic differences in rates between states and between race/ethnicities?

The New York Times reports that there has been an increase in the percent of Black Americans reporting that they are “pretty” or “very” happy (though Blacks lag behind Whites in happiness).  Indeed, while their happiness quotient appears to have dipped a bit this decade, Blacks have reported significantly higher rates of happiness in the ’80s, ’90s, and ’00s, compared to the ’70s.

Still, the article entirely skips over the fascinating gender difference.  While American Black men’s happiness appears to have peaked in the ’80s and ’90s, they show real losses in reported happiness in the ’00s.  In contrast, Black women’s happiness has been steadily rising; they  neither express the same rapid increases or decreases that characterize the trend among men.

When we look at race and gender together, Black men are often among the most disadvantaged groups in society.  They are among the most hard hit by the recession in terms of joblessness.  They are less likely than Black women to enroll in and complete college.  That said, I am hardly an expert in happiness studies… any ideas as to why the gender disparity in self-reported happiness would be so much stronger among Blacks than Whites?

Via Racialicious, and sender-inners Patricia P. and Dmitriy T.M.

Lisa Wade, PhD is an Associate Professor at Tulane University. She is the author of American Hookup, a book about college sexual culture; a textbook about gender; and a forthcoming introductory text: Terrible Magnificent Sociology. You can follow her on Twitter and Instagram.