
My great-grandma was born in 1914 and lived until 2005, so she witnessed an enormous amount of technological and cultural change during her life. I asked her once what single thing she found most impressive or was most grateful had been invented. She answered, without hesitation, “the electric washing machine.” As the mother of 7 children with a husband who did not do housework, laundry had been the bane of her existence. Getting a washing machine that had a hand-powered wringer helped, but it was still exhausting. The way she saw it, getting an electric washing machine changed her life. Her fear of ever again having to do laundry by hand with a washboard was so great that she kept the hand-crank-powered washer next to her electric one until the early 1990s, just in case.
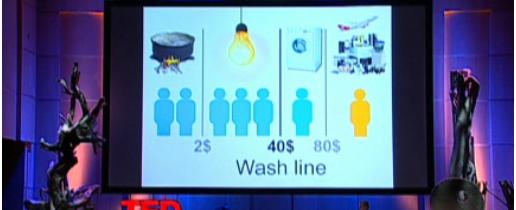
In this TED clip, “Hans Rosling and the Magic Washing Machine,” sent in by Dmitriy T.M., Rosling discusses the ethical problems involved in efforts to combat climate change that rest primarily on telling individuals in developing nations that because we need to use less energy globally, they just can’t have the same appliances and conveniences, like electric washing machines, that those of us living in (post-) industrialized nations do:
Transcript after the jump.


