class

According to an article at the Wall Street Journal,  the average income for the bottom 90% of families fell by over 10% from 2002 – 2012 while the average income for families in all the top income groups grew.  The top 0.01% of families actually saw their average yearly income grow from a bit over $12 million to over $21 million over the same period.  And that is adjusted for inflation and without including capital gains.

MI-BZ607_UNEQUA_G_20131110150005

What was most interesting about the article was its discussion of the dangers of this trend and the costs of reversing it.  In brief, the article noted that many financial analysts now worry that inequality has gotten big enough to threaten the future economic and political stability of the country.  At the same time, it also pointed out that doing anything about it will likely threaten profits.  As the article notes:

But if inequality has risen to a point in which investors need to be worried, any reversal might also hurt.

One reason U.S. corporate profit margins are at records is the share of revenue going to wages is so low. Another is companies are paying a smaller share of profits on taxes. An economy where income and wealth disparities are smaller might be healthier. It would also leave less money flowing to the bottom line, something that will grab fund managers’ attention.

Any bets how those in the financial community will evaluate future policy choices?

Martin Hart-Landsberg is a professor of economics at Lewis and Clark College. You can follow him at Reports from the Economic Front.

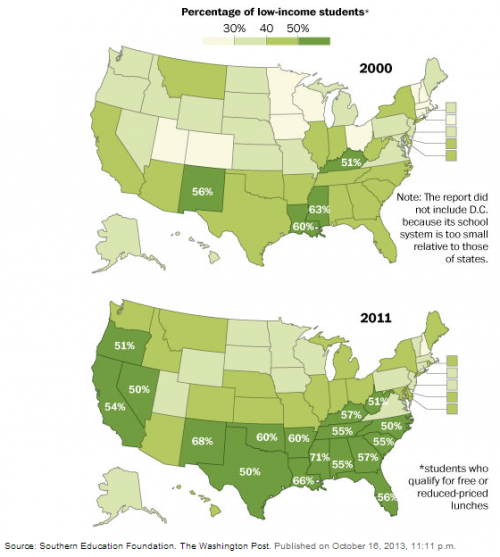
A new study has discovered that 48% of the nation’s 50 million public school students are in poverty, as measured by whether they qualify for free or reduced-priced lunches.  In 17 states, the majority of schoolchildren are poor.  Poverty rates are led by Mississippi, where 71% of children are in poverty.

These data represent a startling rise since 2000:

Screenshot_1

While the statistics are the worst for states in the South and the West, the percent increase in poor children was the highest in the Midwest (up 40% since 2001, compared to 33% in the South, 31% in the West, and 21% in the Northeast).  All, of course, extraordinary increases.

h/t @Miel_Machetes.  Cross-posted at Pacific Standard.

Lisa Wade, PhD is an Associate Professor at Tulane University. She is the author of American Hookup, a book about college sexual culture; a textbook about gender; and a forthcoming introductory text: Terrible Magnificent Sociology. You can follow her on Twitter and Instagram.

Kids growing up in dense, urban environments often turn to basketball as their sport of choice.  This is partly because it fits, in a physical sense.  All things being equal, a basketball court takes up a lot less room than a football or soccer field.  For the economically disadvantaged, it’s also relatively cheap to play.  If you have a court available, you only need a pair of shoes and a ball.  For this reason, whatever population finds itself in this type of environment tends to take up basketball.

That’s why the sport was dominated by Jews in the first half of the 1900s.  Just like many African-Americans today, at that time many immigrant Jewish families found themselves isolated in inner cities.  Basketball seemed like a way out.  “It was absolutely a way out of the ghetto,” explained retired ball player Dave Dabrow.  Basketball scholarships were one of the few ways low income urban Jews could afford college.

Jewish basketball team (1921-22):

CA.1031.firstbasket

Today we refer to stereotypes about Black men to explain why they dominate basketball, but this is an after-the-fact justification.  At the time, very different characteristics — stereotypes associated with Jews — were used to explain why they dominated professional teams. Paul Gallico, sports editor of the NY Daily News in the 1930s, explained that “the game places a premium on an alert, scheming mind, flashy trickiness, artful dodging and general smart aleckness.”  All stereotypes about Jews.  Moreover, he argued, Jews were rather short and so had “God-given better balance and speed.”  Yep.  There was a time when we thought being short was an advantage in the sport of basketball.

Never underestimate the power of institutions and how much things can change.

New York Knicks (1946-1947):

1946 New York Knicks Team PhotoCross-posted at Pacific Standard.


Lisa Wade, PhD is an Associate Professor at Tulane University. She is the author of American Hookup, a book about college sexual culture; a textbook about gender; and a forthcoming introductory text: Terrible Magnificent Sociology. You can follow her on Twitter and Instagram.

Sociologists like to say that gender identities are socially constructed. That just means that what it is, and what it means, to be male or female is at least partly the outcome of social interaction between people – visible through the rules, attitudes, media, or ideals in the social world.

And that process sometimes involves constructing people’s bodies physically as well. And in today’s high-intensity parenting, in which gender plays a big part, this includes constructing – or at least tinkering with – the bodies of children.

Today’s example: braces. In my Google image search for “child with braces,” the first 100 images yielded about 75 girls.

Screenshot_1

Why so many girls braced for beauty? More girls than boys want braces, and more parents of girls want their kids to have them, even though girls’ teeth are no more crooked or misplaced than boys’. This is just one manifestation of the greater tendency to value appearance for girls and women more than for boys and men. But because braces are expensive, this is also tied up with social class, so that richer people are more likely to get their kids’ teeth straightened, and as a result richer girls are more likely to meet (and set) beauty standards.

Hard numbers on how many kids get braces are surprisingly hard to come by. However, the government’s medical expenditure survey shows that 17 percent of children ages 11-17 saw an orthodontist in the last year, which means the number getting braces at some point in their lives is higher than that. The numbers are rising, and girls are wearing most of hardware.

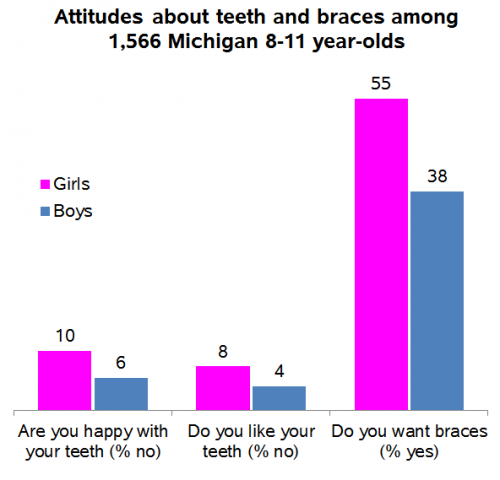
study of Michigan public school students showed that although boys and girls had equal treatment needs (orthodontists have developed sophisticated tools for measuring this need, which everyone agrees is usually aesthetic), girls’ attitudes about their own teeth were quite different:

michigan-braces

Clearly, braces are popular among American kids, with about half in this study saying they want them, but that sentiment is more common among girls, who are twice as likely as boys to say they don’t like their teeth.

This lines up with other studies that have shown girls want braces more at a given level of need, and they are more likely than boys to get orthodontic treatment after being referred to a specialist. Among those getting braces, there are more girls whose need is low or borderline. A study of 12-19 year-oldsgetting braces at a university clinic found 56 percent of the girls, compared with 47 percent of the boys, had “little need” for them on the aesthetic scale.

The same pattern is found in Germany, where 38 percent of girls versus 30 percent of boys ages 11-14 have braces, and in Britain – both countries where braces are covered by state health insurance if they are needed, but parents can pay for them if they aren’t.

Among American adults, women are also more likely to get braces, leading the way in the adult orthodontic trend. (Google “mother daughter braces” and you get mothers and daughters getting braces together; “father son braces” brings you to orthodontic practices run by father-son teams.)

Teeth and consequences

anchors-braces
Caption: The teeth of TV anchors Anderson Cooper, Soledad O’Brien, Robin Roberts, Suzanne Malveaux, Don Lemon, George Stephanopolous, David Gregory, Ashley Banfield, and Diane Sawyer.

.

Today’s rich and famous people – at least the one whose faces we see a lot – usually have straight white teeth, and most people don’t get that way without some intervention. And lots of people get that.

Girls are held to a higher beauty standard and feel the pressure – from media, peers or parents – to get their teeth straightened. They want braces, and for good reason. Unfortunately, this subjects them to needless medical procedures and reinforces the over-valuing of appearance. However, it also shows one way that parents invest more in their girls, perhaps thinking they need to prepare them for successful careers and relationships by spending more on their looks.

When they’re grown up, of course, women get a lot more cosmetic surgery than men do – 87 percent of all surgical procedures, and 94% of Botox-type procedures – and that gap is growing over time.

As is the case with lots of cosmetic procedures, people from wealthier families generally are less likely to need braces but more likely to get them. But add this to the gender pattern, and what emerges is a system in which richer girls (voluntarily or not) and their parents set the standard for beauty – and then reap the rewards (as well as harms) of reaching it.

Cross-posted at Family Inequality, Adios Barbie, and Jezebel.

Philip N. Cohen is a professor of sociology at the University of Maryland, College Park, and writes the blog Family Inequality. You can follow him on Twitter or Facebook.

Screenshot_1In this powerful spoken word, poet Clint Smith, who is also a teacher in Washington D.C., tells the stories of some of his students. It puts names and details to the struggles of young people trying to thrive in an urban environment that is all too often indifferent to their survival.

Via Upworthy.

Lisa Wade, PhD is an Associate Professor at Tulane University. She is the author of American Hookup, a book about college sexual culture; a textbook about gender; and a forthcoming introductory text: Terrible Magnificent Sociology. You can follow her on Twitter and Instagram.

The dominant firms in the U.S. and other major capitalist counties are happily making profits, but they aren’t interested in investing them in new plants and equipment that increase productivity and create jobs.  Rather they prefer to use their earnings to acquire other firms, reward their managers and shareholders, or increase their holdings of cash and other financial assets.

The chart below, taken from a Michael Burke post in the Irish Left Review, shows trends in both U.S profits and investment .

1

As you can see the increase in profits (in orange) has swamped the increase in investment (in blue) over the relevant time period; in fact, investment in current dollars has actually been falling.

Looking at the ratio between these two variables helps us see even more clearly the growth in firm reluctance to channel profits into investment.  The investment ratio (investment/profits) was 62% in 1971, peaked at 69% in 1979, fell to 61% in 2000 and 56% in 2008, and dropped to an even lower 46% in 2012.

According to Burke,  if U.S. firms were simply to invest at the level they did in 1979, not even the peak, the increase in investment in the American economy would exceed $1.5 trillion, close to 10% of GDP.

The same dynamic is observable in the other main capitalist economies:

In 1995 the investment ratio in the Euro Area was 51.7% and by 2008 it was 53.2%. It fell to 47.1% in 2012. In Britain the investment ratio peaked at 76% in 1975 but by 2008 had fallen to 53%. In 2012 it was just 42.9% (OECD data).

So what are firms doing with their money? As Burke explains:

The uninvested portion of firms’ surplus essentially has only two destinations, either as a return to the holders of capital (both bondholders and shareholders), or is hoarded in the form of financial assets. In the case of the U.S. and other leading capitalist economies both phenomena have been observed. The nominal returns to capital have risen (even while the investment ratio has fallen) and financial assets including cash balances have also risen.

So, with firms seeing no privately profitable outlet for their funds, despite great societal needs, their owners appear content to reward themselves and sock away the rest in the financial system.  In many ways this turns out to be a self-reinforcing dynamic.  No wonder things are so bad for so many.

Cross-posted at Reports from the Economic Front.

Martin Hart-Landsberg is a professor of economics at Lewis and Clark College. You can follow him at Reports from the Economic Front.
Last week Kay Hymowitz (who sometimes works out of a PO Box rented by Brad Wilcox) wrote the following in the LA Times:

As far back as the 1970s, family researchers began noticing that… [b]oys from broken homes were more likely than their peers to get suspended and arrested… And justice experts have long known that juvenile facilities and adult jails overflow with sons from broken families. Liberals often assume that these kinds of social problems result from our stingy support system for single mothers and their children. But the link between criminality and fatherlessness holds even in countries with lavish social welfare systems.

Ah, the link between criminality and fatherlessness again. So ingrained is the assumption that crime rates always go up that conservatives making this argument do not even see the need to account for the incredible, world-historical drop in violence that has accompanied the collapse of the nuclear family. I know Kay Hymowitz knows this, because we’ve argued about it before. But if her editors and readers don’t, why should she make a big deal out of it?

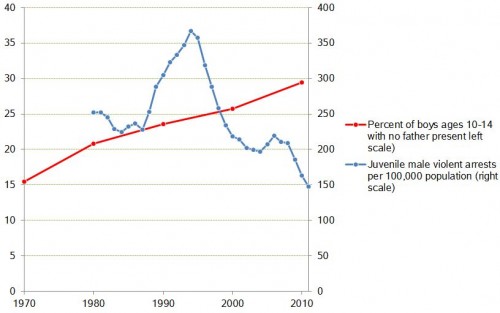
In this graph I show the scales down to zero so you can see the proportional change in each trend: father-not-present boys ages 10-14 and male juvenile violent-crime arrest rates.

1

I’m not arguing about whether boys living without fathers are more likely to commit crimes. I’m just saying that this is very unlikely to be the major cause of male juvenile violent crime if the trends can move so drastically in opposite directions at the same time. These aren’t little fluctuations. Even if you leave out the late-80s-early-90s spike in crime, arrests fell about 40% from 1980 to 2010 while father-absent boys increased almost 50%.

If you are going to argue for a strong association — which Hymowitz does — and use words like “tide,” you should at least acknowledge that the problem you are trumpeting is getting better while the cause you are bemoaning is getting worse.

Cross-posted at Family Inequality.

Philip N. Cohen is a professor of sociology at the University of Maryland, College Park, and writes the blog Family Inequality. You can follow him on Twitter or Facebook.

The phrase “economic mobility” refers to the likelihood that a child will end up in the same or a different economic strata than their parent.  Education is usually cited as a key to improving economic well-being intergenerationally. Conversely, but often unstated, is the idea that if a child of college graduates doesn’t attend college, than they should perhaps do worse than their parents.

What does the data say?

The figure below is from the Pew Economic Mobility Project.  Along the horizontal axis is the parent’s household income quintile: economic strata broken up into fifths from the lowest (left) to highest (right).  The bars represent the adult child’s income for those who didn’t graduate from college (red) and those that did (blue).

1

Often we focus on the left side.  Does attending college help poor and working class Americans?  The answer is yes. Only 10% of children born into the bottom 20% of household incomes will grow up and stay in the bottom 20%, compared to almost half of people who don’t go to college.    It’s similar, if less stark, for those in the 2nd to bottom quintile.

But what about the rich kids?  I want to look at the right side.  Notice that a quarter of kids born into the top quintile stay there even if they don’t get a college degree.  Half of non-degree earning children will stay in the top 40% of income earners.

Among the richest kids who do go to college, about 50% will remain in the top quintile.  There are lots of reasons for this, but one is paternal connections.  One study found that a whopping 70% of sons of the 1% had worked for the same employer as their father.  I wonder how high that number would be if we added daddy’s friends?

In sum, it’s hard to go up from down below, but it’s also relatively easy to stay sitting pretty if you’re already way up there.

Via Matthew O’Brien at The Atlantic. Cross-posted at Pacific Standard.

Lisa Wade, PhD is an Associate Professor at Tulane University. She is the author of American Hookup, a book about college sexual culture; a textbook about gender; and a forthcoming introductory text: Terrible Magnificent Sociology. You can follow her on Twitter and Instagram.