class

As part of an ongoing series about inequality in the U.S., tonight PBS will air a segment on the psychology of wealth: that is, how the experience of being (or feeling) well-off impacts our attitudes and behaviors.

As this video clip explains, having wealth appears to affect us in a number of ways. Having more tends to make individuals feel entitled to even more; research shows they feel less generous and more entitled to take resources (such as candy they have been told is for children coming in later), more willing to cheat, and more accepting of unethical behavior. Privileged individuals — even those whose privilege is just having Monopoly rules rigged to ensure they win in an experiment — tend to believe they deserve their privilege.

These patterns show up regardless of political orientation, affecting both liberals and conservatives. Whatever good intentions we might have, the experience of being wealthy appears to affect us in ways it may be hard for individuals to notice, making privileged people feel they deserve their position and justifying behaviors that consolidate even more advantages.

Transcript available at the PBS website. Also check out our earlier posts presenting PBS clips on Americans’ misperceptions of the level of inequality in the U.S. and the health impacts of inequality.

Gwen Sharp is an associate professor of sociology at Nevada State College. You can follow her on Twitter at @gwensharpnv.

Cross-posted at The Wild Magazine.

Poverty in the United States is stereotypically associated with racial minorities in urban centers. However, a closer look at social geography reveals a more complex situation: a majority of poor people are white and live in the suburbs. This makes sense when you consider that whites are the largest racial group in the U.S., making up 75% of the population, and that there are three times as many suburbanites than urbanites.

A majority of Americans are losing wealth, and we know it’s going straight to the top. This is not a conspiracy theory, but the economic arrangement of the last 40 years. The New Deal, which created the middle class and the American Dream, was systematically dismantled by elite interest. The revolving door, the shuffling of elites in top positions of power between the public and private sectors, made this possible. The New Deal was abandoned for neoliberal policy. As a result, the comfortable middle class lifestyle was replaced by unemployment and working class struggle.

Suburban poverty normally reflects the spread of metropolitan poverty, but in recent years, suburban poverty has been growing at a faster rate. From 2010-2011, poverty in America’s 100 largest metro areas increased by 5.9% overall. Suburban poverty grew at a rate of 6.8%, while urban poverty grew only 4.7%. In general, the poverty rates in urban areas are still higher (21%) than those in the suburbs (11%). Most notable is the rate of change in the suburbs, which can be attributed to increasing inequality, the housing market crash, gentrification, efforts to make low-income people more mobile, and public housing vouchers.

Screenshot_1

For the past decade, suburbanites commuted between suburbs rather than into cities for work. More affluent, nearby suburbs provide low-wage service jobs in food and retail. Poverty rates in suburbia are rising due to a crumbling middle class, but the poor are still mainly concentrated in inner-ring suburbs close to cities, and on the fringe — former rural areas consumed by suburban sprawl.

Poverty’s expansion to the suburbs is a symptom of an increasingly unequal society. The geographic isolation of the suburban poor in the inner and outer rings of suburbia troubles the validity of the claim that poverty moved to the suburbs. More accurately, people are getting poorer and more people live in the suburbs—or areas now designated as such. It’s plausible that economic inequality and leapfrog developments have changed the sociogeographic landscape. Low-income earners are displaced to the outskirts of the city (inner-ring of the suburbs) due to gentrification, and the rural poor are now more easily counted among the suburban poor due to suburban sprawl. Whatever the case, suburban poverty presents unique challenges to policy makers because federal antipoverty resources are tailored for densely populated urban areas. The stereotypical images of inner city poverty and suburban affluence are the ultimate fiction.

Kara McGhee is a PhD student in sociology at the University of Missouri specializing in culture, identity, and inequalities. She is a regular contributor for The WILD Magazine

While the stereotype of the college professor might still be an elbow-patched intellectual cozied up in an office, it might be more accurate to place him in his car.  A new report from the American Association of University Professors finds that more than 40% of college instructors are part-time, often driving from campus to campus to cobble together enough classes to enable them to pay rent.  These types of employees far outnumber tenured and tenure-track faculty, who make up less than a quarter.

1

This data suggest that the term “precariat” applies well to a significant proportion of college and university professors. Coined by economist Guy Standing, the term is meant to draw attention to the economic fragility of many lower wage workers in today’s labor market.  It’s a combination of the word “precarious” and “proletarian,” a word that is used to refer to the working class under capitalism.

Part-time faculty count as part of the precariat because their jobs are contingent (renewed semester to semester), low paid, and bring little or no benefits.  Let me put it this way.  I just finished my first year as a tenured professor after six years on the tenure track.  I teach five classes.  An adjunct at a public research university would have to teach more than twenty-three classes to earn my salary (average pay is $3,200/class); someone teaching at community colleges would have to teach more than thirty-three (at $2,250/class).  Of course, my salary also reflects research and institutional service, but my hourly wage is obviously far out-of-proportion to that of part-time faculty.  Plus I get a wide range of benefits; adjuncts usually get nothing.

When government funding of higher education shrinks, colleges and universities respond by cutting corners where they can.  Hiring adjuncts is one way to do that.  It’s important to remember, then, that funding cuts hurt not only students; they also hurt jobs.

See also How Many PhDs are Professors?

Via Jordan Weissman at The Atlantic. Cross-posted at Pacific Standard.

Lisa Wade, PhD is an Associate Professor at Tulane University. She is the author of American Hookup, a book about college sexual culture; a textbook about gender; and a forthcoming introductory text: Terrible Magnificent Sociology. You can follow her on Twitter and Instagram.

Screenshot_2As our society becomes increasingly technological, I love stories that remind us of the value of simpler ways to solve problems, like a faux bus stop to catch escapee nursing home residents or dogs that are trained to sniff out cancer (both stories here).

This weekend we were treated to another such story, this time by Google. The company has announced a plan to bring internet to the whole world… with balloons.  The very first launch of a gas balloon was in 1783.  Two hundred and thirty years later, the company aims to deliver what is arguably the defining feature of our age — the internet — with helium-filled balloons.  That technology will then bring almost countless other technologies, such as medical advances and agricultural information, to people who are largely excluded from them now.  A fantastical plan.

Here’s how it’ll work:

Lisa Wade, PhD is an Associate Professor at Tulane University. She is the author of American Hookup, a book about college sexual culture; a textbook about gender; and a forthcoming introductory text: Terrible Magnificent Sociology. You can follow her on Twitter and Instagram.

Cross-posted at Montclair Socioblog.

We got another reminder last week that despite complaints about federal government programs that give money to the poor, when it comes to taxes, the government is much more generous to the wealthy.  The news came from a report from the Congressional Budget Office on tax expenditures.

These are the ways that the government uses the tax system to give money to people. Some expenditures are tax credits, which can take the form of cash payments.  Others are tax breaks — taxing people less than the going rate. For example, if I am in the 35% tax bracket, but the government charges me only 15% on the $100,000 I made playing the stock market, the government is giving me $20,000 it could otherwise have had me pay in taxes. That’s an expense. The preferential rate for my luck in the market costs the government $20,000.

The justification for these expenditures is that they are a way the government can encourage people to do something that it wants them to do.  With tax breaks, the government is basically paying people by not charging them full tax fare — encouraging them to buy a house or give to charity or get health insurance at their work.  Similarly with the tax credits that go mostly to the poor. We want people to hold a job and to care for their kids.  The child tax credit gives people more money to care for their children.  The Earned Income Tax Credit pays them for working, even at jobs that pay very little.  By the same logic, the government is paying me to invest my money in companies — or put another way, to play the stock market.

This government largesse, however, benefits some people more than others:

1

About half of all tax expenditures go to the top quintile (top 20% of income earners).  The bottom 80% of earners divide the other half.  And within that richest quintile, the top 1% receive 15% of all tax expenditures (this distribution of tax breaks roughly parallels the distribution of income). Were you really expecting Sherwood Forest?

Here is a breakdown of the costs of these different tax expenditures:

2

The Earned Income Tax Credit, which benefits mostly the poor, costs less than $40B.  The tab for the low tax on investment income (capital gains and dividends) is more than twice that, and nearly all of that goes to the top quintile.  More than two-thirds goes to the richest 1%.

Dylan Matthews at the Washington Post WonkBlog regraphed the numbers to show the total amounts overall plus the amounts in each category for each income group:

3

The point? People complain about government payments to the poor, but tax breaks are also payments, though less obviously so, to the rich.  And those tax breaks cost the government a lot more money.

Jay Livingston is the chair of the Sociology Department at Montclair State University. You can follow him at Montclair SocioBlog or on Twitter.

This post originally appeared in 2010.

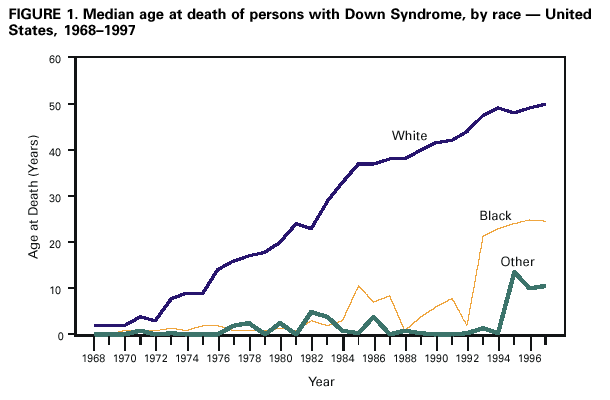
Most of us familiar with Down‘s Syndrome know that it brings characteristic facial features and delayed or impaired cognitive development. People with Down, however, are also more vulnerable than the general population to diabetes, leukemia, and infectious and autoimmune disease, and about 40% are born with heart defects.

For most of history, then, the life expectancy of people with Down was very low.  But, with advances in knowledge and access to health care, life expectancy has risen dramatically… especially for white people:

The Centers for Disease Control explain that severity of Down does not vary by race, so most likely the cause of the gap in life expectancy is differences in the quantity and quality of health care.

Possibilities include differences in factors that may be associated with improved health in the general population such as socioeconomic status, education, community support, medical or surgical treatment of serious complications, or access to, use of, or quality of preventative health care.

This is just one striking example of the wide racial gap in health outcomes and access to care.  We see data with similar patterns most everywhere we look.  As examples, pre-term birthscancer diagnosis and treatment, and likelihood of living near a toxic release facility.

Morbidity and Mortality Weekly Report, via Family Inequality.

Lisa Wade, PhD is an Associate Professor at Tulane University. She is the author of American Hookup, a book about college sexual culture; a textbook about gender; and a forthcoming introductory text: Terrible Magnificent Sociology. You can follow her on Twitter and Instagram.

Cross-posted at The Atlantic and Family Inequality.

In 1996 the Hoover Institution published a symposium titled “Can Government Save the Family?”  A who’s-who list of culture warriors — including Dan Quayle, James Dobson, John Engler, John Ashcroft, and David Blankenhorn — were asked, “What can government do, if anything, to make sure that the overwhelming majority of American children grow up with a mother and father?”

There wasn’t much disagreement on the panel.  Their suggestions were (1) end welfare payments for single mothers, (2) stop no-fault divorce, (3) remove tax penalties for marriage, and (4) fix “the culture.” From this list their only victory was ending welfare as we knew it, which increased the suffering of single mothers and their children but didn’t affect the trajectory of marriage and single motherhood.

So the collapse of marriage continues apace. Since 1980, for every state in every decade, the percentage of women who are married has fallen (except Utah in the 1990s):

1

Red states (last four presidential elections Republican) to blue (last four Democrat), and in between (light blue, purple, light red), makes no difference:

2

But the “marriage movement” lives on. In fact, their message has changed remarkably little. In that 1996 symposium, Dan Quayle wrote:

We also desperately need help from nongovernment institutions like the media and the entertainment community. They have a tremendous influence on our culture and they should join in when it comes to strengthening families.

Sixteen years later, in the 2012 “State of Our Unions” report, the National Marriage Project included a 10-point list of familiar demands, including this point #8:

Our nation’s leaders, including the president, must engage Hollywood in a conversation about popular culture ideas about marriage and family formation, including constructive critiques and positive ideas for changes in media depictions of marriage and fatherhood.

So little reflection on such a bad track record — it’s enough to make you think that increasing marriage isn’t the main goal of the movement.

Plan for the Future

So what is the future of marriage? Advocates like to talk about turning it around, bringing back a “marriage culture.” But is there a precedent for this, or a reason to expect it to happen? Not that I can see. In fact, the decline of marriage is nearly universal. A check of United Nations statistics on marriage trends shows that 87 percent of the world’s population lives in countries with marriage rates that have fallen since the 1980s.

Here is the trend in the marriage rate since 1940, with some possible scenarios to 2040 (source: 1940-19601970-2011):

3

Notice the decline has actually accelerated since 1990. Something has to give. The marriage movement folks say they want a rebound. With even the most optimistic twist imaginable (and a Kanye wedding), could it get back to 2000 levels by 2040? That would make headlines, but the institution would still be less popular than it was during that dire 1996 symposium.

If we just keep going on the same path (the red line), marriage will hit zero at around 2042. Some trends are easy to predict by extrapolation (like next year’s decline in the name Mary), but major demographic trends usually don’t just smash into 0 or 100 percent, so I don’t expect that.

The more realistic future is some kind of taper. We know, for example, that decline of marriage has slowed considerably for college graduates, so they’re helping keep it alive — but that’s still only 35 percent of women in their 30s, not enough to turn the whole ship around.

So Live With It

So rather than try to redirect the ship of marriage, we have to do what we already know we have to do: reduce the disadvantages accruing to those who aren’t married — or whose parents aren’t married. If we take the longer view we know this is the right approach: In the past two centuries we’ve largely replaced such family functions as food production, healthcare, education, and elder care with a combination of state and market interventions. As a result — even though the results are, to put it mildly, uneven — our collective well-being has improved rather than diminished, even though families have lost much of their hold on modern life.

If the new book by sociologist Kathryn Edin and Timothy Nelson is to be believed, there is good news for the floundering marriage movement in this approach: Policies to improve the security of poor people and their children also tend to improve the stability of their relationships.  In other words, supporting single people supports marriage.

To any clear-eyed observer it’s obvious that we can’t count on marriage anymore — we can’t build our social welfare system around the assumption that everyone does or should get married if they or their children want to be cared for. That’s what it means when pensions are based on spouse’s earnings, employers don’t provide sick leave or family leave, and when high-quality preschool is unaffordable for most people. So let marriage be truly voluntary, and maybe more people will even end up married. Not that there’s anything wrong with that.

Philip N. Cohen is a professor of sociology at the University of Maryland, College Park, and writes the blog Family Inequality. You can follow him on Twitter or Facebook.

Cross-posted at Montclair SocioBlog.

The magic of demographic knowledge is a memorable moment in John Sayles’s 1984 movie “Brother From Another Planet.” On the A train, a young man shows an elaborate card trick to the title alien, who looks like an African American but seems to have no understanding of the trick. So the magician offers another.

From 59th St. to 125th St. is one stop on the express.  But as the movie shows, that short ride covers a large demographic change, and it’s not just racial.  The New Yorker has posted interactive graphics showing the median income of the census tracts surrounding subway stations.

1

Take the A train one stop — from the southern border of Central Park to a few blocks above its northern border — and see median income drop by $100,000.

Many other lines travel the extremes of economic inequality.  My line is the 2:

2

In the early morning commute, I see blue collar workers in their hoodies or rough jackets and steel-toe boots next to well-dressed people reading The Wall Street Journal.  They didn’t get on at the same stop.  The people who live in and work in the Wall Street census tract, which includes Park Place, are not on the train.  Here’s what their housing looks like:

BATTERY PARK CITY: as a pioneer. It's all Green, environmentally friendly.

And here is Franklin St., Brooklyn:

4

The subway demographic trick is not limited to New York. Here’s a time-lapse video of the Red Line of Chicago’s CTA.

Despite the social class segregation in housing, in cities like New York and Chicago, people of vastly different economic circumstances are likely to share the same subway car, at least for a few stops.  Yet I don’t get a sense of strong resentment or even envy among the have-nots (though I wish I had systematic data on this).  This is similar to the findings of Rachel Sherman, who studied how workers at high-end hotels thought of their guests.

New York and Chicago, however, are also where the rich are more likely to be liberal and in favor of redistributionist policies.  As Andrew Gelman has shown, the wealthy in rich states are far more liberal than the wealthy in poor states.  That may be partly because in rich states, the wealthy live in the large cities.  It would be interesting to see if we saw the same effect if we looked at Upstate New York, Downstate Illinois, or Massachusetts outside Rte. 128.

HT: Jenn Lena for the link.

Jay Livingston is the chair of the Sociology Department at Montclair State University. You can follow him at Montclair SocioBlog or on Twitter.