Search results for The

Social scientists rely on the normal distribution all the time. This classic “bell curve” shape is so important because it fits all kinds of patterns in human behavior, from measures of public opinion to scores on standardized tests.

But it can be difficult to teach the normal distribution in social statistics, because at the core it is a theory about patterns we see in the data. If you’re interested in studying people in their social worlds, it can be more helpful to see how the bell curve emerges from real world examples.

One of the best ways to illustrate this is the “Galton Board,” a desk toy that lets you watch the normal distribution emerge from a random drop of ball-bearings. Check out the video below or a slow motion gif here.

The Galton Board is cool, but I’m also always on the lookout for normal distributions “in the wild.” There are places where you can see the distribution in real patterns of social behavior, rather than simulating them in a controlled environment. My absolute favorite example comes from Ed Burmila:

The wear patterns here show exactly what we would expect a normal distribution to tell us about weightlifting. More people use the machine at a middle weight setting for the average strength, and the extreme choices are less common. Not all social behavior follows this pattern, but when we find cases that do, our techniques to analyze that behavior are fairly simple.

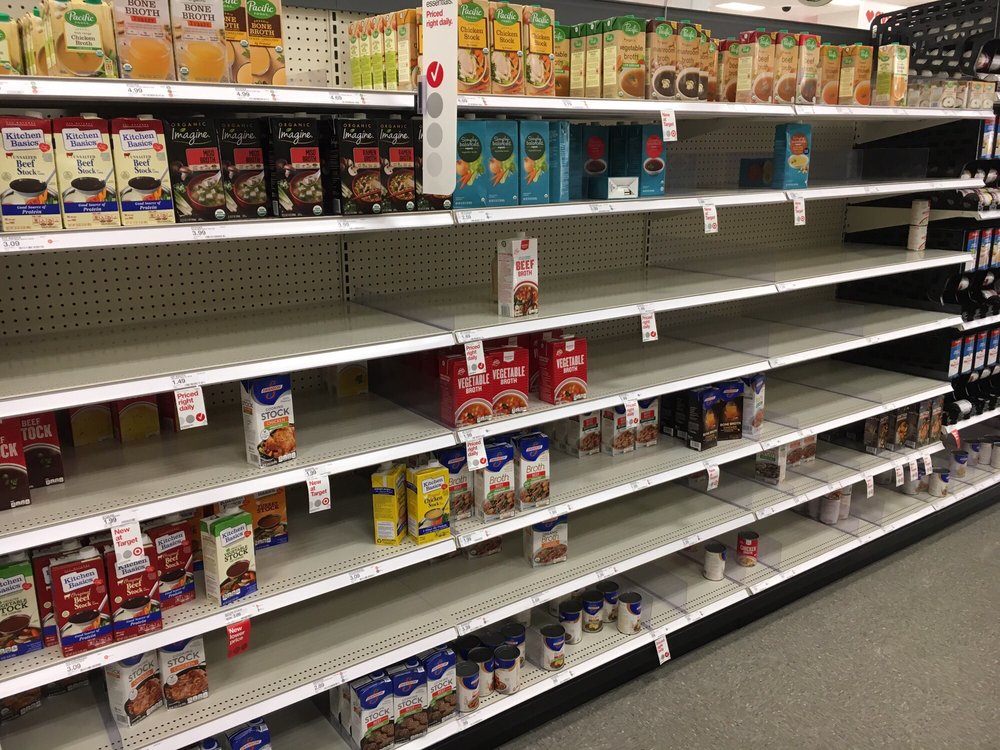
Another cool example is grocery shelves. Because stores like to keep popular products together and right in front of your face (the maxim is “eye level is buy level“), they tend to stock in a normally-distributed pattern with popular stuff right in the middle. We don’t necessarily see this in action until there is a big sale or a rush in an emergency. When stores can’t restock in time, you can see a kind of bell curve emerge on the empty shelves. Products that are high up or off to the side are a little less likely to be picked over.

Paul Swansen, Flickr CC

Have you seen normal distributions out in the wild? Send them my way and I might feature them in a future post!

Evan Stewart is an assistant professor of sociology at University of Massachusetts Boston. You can follow his work at his website, or on BlueSky.

Housing is a serious issue across the country, and here in Minneapolis there has been a big discussion about new zoning policies that could be a model for cities everywhere. 

In true midwestern fashion, the favored way to fight this out on the ground is the passive-aggressive yard sign. Homeowners kicked it off, followed by a pro-development crowd seeking more affordable housing.

Regardless of where you stand on the issue, both groups draw grassroots support from local residents who live in Minneapolis and have a stake in how it might change. Just recently, though, someone else jumped on the bandwagon. A new set of shiny yard signs started popping up all over my neighborhood. Someone had coordinated an overnight drop, putting out three or more signs every block with this slogan:

Many of the signs were outside apartment buildings, and it turns out that they came from a group of landlords organizing against protections for renters. I came home to my apartment one day to find three signs posted in the front yard of the building. Nobody told us these signs were going up, and many of them were removed the following week.

This is a classic example of what social scientists call “astroturfing”—a practice where business leaders copy grassroots activism strategies to advocate for their political interests. According to sociologist Edward Walker, full-on astroturfing where a business relies on deception to suggest grassroots support is pretty rare. This is a risky practice that can backfire if they get caught. Instead, business are getting much more savvy by adopting other kinds of grassroots organizing tactics to drive attention to their interests.

These signs show the power of astroturfing, because we usually assume a lawn sign is a pretty direct statement—one that represents the person who lives behind it. Sure, landlords can lobby just like everyone else, but do they have a right to do it in front of where their tenants live, especially if they might disagree? A counter-mobilization effort is already underway in the neighborhood.

Evan Stewart is an assistant professor of sociology at University of Massachusetts Boston. You can follow his work at his website, or on BlueSky.

In the United States, men have higher rates of life-threatening health conditions than women — including uncontrolled high blood pressure and heart disease. Recent research published in Socius shows they are also less likely than women to consider becoming vegetarian, and changing these eating habits may be important for their health and for the environment.

To learn more about meat and masculinity, Researchers Sandra Nakagawa and Chloe Hart conducted experiments to test whether a threat to masculinity influences men’s affinity to meat. In one experiment, the researchers told some men their answers from a previous gender identity survey fell in the “average female” range, while others fell into the “average male” range. The authors expected men who received “average female” results to feel like their masculinity was in question, and possibly express stronger attachment to meat on later surveys.

Men who experienced a threat to their masculinity showed more attachment to meat than those who did not experience the threat. They were also more likely to say they needed meat to feel full and were less likely to consider switching to a diet with no meat. This study shows how gendered assumptions about diet matter for how men think about maintaining their health, highlighting the standards men feel they must meet — and eat.

Allison Nobles is a PhD candidate in sociology at the University of Minnesota and Graduate Editor at The Society Pages. Her research primarily focuses on sexuality and gender, and their intersections with race, immigration, and law.

As summer approaches and ads for part-time student work start popping up all over campus, it is a good time to talk about the sociology of sales. The Annex podcast recently ran a segment on multi-level marketing (MLM) organizations, and I just finished the binge-worthy podcast series The Dream, which follows the history of these companies and the lives of people who sell their products.

Photo Credit: Retrogasm, Flickr CC

Sometimes called direct sales or network marketing, these organizations offer part time, independent work selling everything from handbags to health supplements. The tricky part is that many of these groups spend more time encouraging people to recruit friends and family to sell, rather than moving products through traditional retail markets. People draw on their nearby social networks to make sales and earn bonuses, often by hosting parties or meeting in small groups.

You might have seen pitches for one of these groups at your local coffee shop or campus. Some MLMs get busted for using this model to build illegal pyramid schemes, while other direct sales companies claim to follow the law by providing employee protections.

Photo Credit: Neo_II, Flickr CC

MLMs are a rich example for all kinds of sociology. You could do an entire Introduction to Sociology class branching out from this case alone! Here are a few examples that The Dream inspired for me (find episodes here):

  • Economic sociologists can talk about the rise of precarious labor and the gig economy—conditions where more people feel like they need to be entrepreneurs just to survive. MLMs are particularly good at using these social conditions for recruitment.
  • Sociologists of gender will have a lot to say about how these groups recruit women, targeting our gendered assumptions about who needs part-time, flexible work and who is best suited to do the emotional work of sales. Pair readings with Episode 2: “Women’s Work.”
  • I’ve seen a fair number of MLM pitches in coffee shops and accidentally walked into a few in college. Watching these pitches is a masterclass in symbolic interactionism, and students can see how people build rapport with each other through face work and sales parties as rituals. Pair with Episode 3: “Do you party?” 
  • Many of these companies are either religiously-affiliated or lean on religious claims to inspire and motivate recruits. Sociologists of religion and culture can do a lot with the history of the New Thought movement. Pair The Protestant Ethic with Episode 4: “The Mind is a Fertile Field.”
  • Political sociologists can use the history of how these groups get around regulation to talk about corporate influence in the political world and how elites coordinate. Sociologists of Law will also love the conversation about legitimacy, especially how direct sales organizations learned to distinguish themselves from “clearly illegal pyramid schemes.” Pair with Episode 7: “Lazy, Stupid, Greedy or Dead.”

This is a great focus topic for the social sciences, both because it touches on so many trends in the US culture and economy, and because college students and recent graduates are often a target market for many of these groups.

Evan Stewart is an assistant professor of sociology at University of Massachusetts Boston. You can follow his work at his website, or on BlueSky.

The 2018 General Social Survey data was just recently publicly released. We were eager to see how things shifted, especially for the demographic questions on sexual identity. As of 2018, it has officially been one decade that GSS has been asking respondents to characterize their sexual identity on the survey, you can self-classify as “heterosexual or straight,” “gay,” “lesbian,” “homosexual,” “bisexual,” or “don’t know.” This is only one way to measure sexual identity among many,  but the growth in LGB identity has been generally comparable across instruments in the past.

As Tristan has noted before, reporting on shifts in the LGBT population treats the group as homogenous and artificially presents growth in LGBT identity as though it might be equally distributed among the L’s, G’s, B’s, and T’s. But that’s not true. Bisexual women account for the lion’s share on the growth in LGBT identification. And, as Tristan and Mignon Moore showed in 2016, young Black women account for a disproportionate amount of the growth in LGB identification.

Data from GSS shows an increase in LGB identification between 2008 and 2018. Below, we charted shifts in those identifying as lesbian and gay alongside those identifying as bisexual. Consistent with what Tristan showed in 2016, bisexual identification continues to be increasing at a steeper rate.

In fact, when you look at the proportions identifying as lesbian and gay or bisexual in 2008 and compare those with the proportions identifying as lesbian and gay or bisexual in 2018, lesbian and gay identifications have not really moved much. But bisexual identities continue to increase every year.

This is consistent with other national survey work. For example, using the National Survey of Family Growth (NSFG), Compton, Farris and Chang (2015) found that almost nine percent of women in the sample and about four percent of men in the sample in 2008 and 2002 reported behavior as bisexual; that is, having sex with at least one male and at least one female partner in their lifetime. Rates of self-identification as bisexual were much lower (in 2008 0.43% of women and 0.38% of men). Perhaps with increases in social tolerance people are more likely to claim bisexual identities today, regardless of their participation in the behavior.

Previous work has also suggested that much of the growth in LGB identities is happening among women. The GSS data show that the shift appears to be primarily happening among bisexual women. Indeed, bisexuality continues to be a more popular sexual identity than lesbian among women, but a less popular sexual identity than gay among men, as others have shown. As of 2018, almost 6% of women responding to the survey identified as bisexual compared with 1.5% in 2008. Comparatively, shifts in lesbian identities among women and both gay and bisexual identities among men really haven’t shifted much.

And similar to previous analyses (herehere, and here), this shift is particularly pronounced among the young. The figure below shows changes in lesbian and gay identities alongside shifts in bisexual identities for four separate age cohorts. The real shift in among bisexual identification among 18-34 year-olds. Between 7 and 8% identified as  bisexual on the 2018 GSS survey. This is all the more interesting when you look at the 2008 data on these figures. Bisexuality did not stand out in these data in 2008. In fact, in 2008, more people identified as lesbian and gay than bisexual. This shift has emerged and grown in an incredibly short period of time.

As other data have shown as well (see here and here, for instance), people of color account for a disproportionate amount of this shift. Black bisexuals accounted for almost 7% of Black respondents on the 2018 GSS. That’s a big shift as well. And while bisexual and lesbian/gay identities were moving along similar trajectories for Black Americans through 2016, as of 2018, bisexuality was much more common (as has been true for White respondents and those of other races… yes “other race” is actually the category GSS uses… and no, it’s not a good idea).

So what do we do with all of this? One thing that we ought to take from this is to take scholarship on bisexuality more seriously. As a sexual identity, bisexuality is less studied than it ought to be. But bisexuality has continued to grow and continues to represent a larger number of people’s sexual identities than lesbian and gay combined. This is interesting for a number of reasons, but one is that much of the growth in the LGBT community might actually be the result of changes in the population of bisexual identifying people (and this is a group that is disproportionately composed of women). Whether bisexual identifying people understand themselves as a part of a distinct sexual minority, though, is a question that deserves more scholarship. If we are going to continue to group bisexuals with lesbian women and gay men when we report on shifts in LGB populations, this might be something that deserves better understanding and more attention. Context matters in how we understand identities and how they change or evolve over time.

Originally posted at Inequality by Interior Design. Read more and dive into the details there!

D’Lane R. Compton, PhD is an associate professor of sociology at the University of New Orleans with a background in social psychology, methodology, and a little bit of demography, they are usually thinking about food, country roads, stigma, queer nooks and places, sneakers and hipster subcultures. You can follow them on twitter.

Tristan Bridges, PhD is a professor at the University of California, Santa Barbara. He is the co-editor of Exploring Masculinities: Identity, Inequality, Inequality, and Change with C.J. Pascoe and studies gender and sexual identity and inequality. You can follow him on Twitter here. Tristan also blogs regularly at Inequality by (Interior) Design.

Whether you’re chanting at a protest, partying at a concert, or cheering at a football game, there’s a special kind of excitement that comes from being in a crowd. Émile Durkheim called this “collective effervescence,” and today sociologists use this term to talk about the bubbly emotion that comes from being in the middle of the action.

Photo Credit: Pabak Sarkar, Flickr CC

One of the tricky parts of studying collective effervescence is figuring out what exactly supercharges these social interactions. Does it come from the simple fact that you’re in a crowd, or is it in the way people engage with each other when they get there? If we think about the morning commute or the line at the grocery store, most crowds seem pretty unpleasant and not so effervescent. Recent research published in Sociological Science by Lasse Suonperä Liebst sheds light on the answer with a super fun approach to data collection.

Photo Credit: Banalities, Flickr CC

To track collective effervescence, a team of researchers showed up at The Roskilde Festival—one of Europe’s largest music festivals—to survey attendees about whether their camping experiences were “festive, noisy, hectic, boring, or calm.” 

The survey was sampled by a team of 11 university students during the five warm-up days of the festival, which precede the scheduled music program. During this period, tens of thousands of visitors build tent camps and engage in extensive drinking and partying activities. As such, the festival offered a “natural laboratory” (Park 1939) to examine the factors underpinning the collective effervescence that prior studies have identified in this (Pedersen 2014) and similar festival contexts (Niekrenz 2014).

Lasse Suonperä Liebst – “Exploring the Sources of Collective Effervescence: A Multilevel Study.Sociological Science.

The survey team also collected respondents’ gender, age, previous festival attendance, how much their camp sites were interacting with others, and how much they personally enjoyed the party atmosphere. Then, they used aerial photography to map out how dense the festival crowds were and how close each campsite was to the central stage. 

With all this information collected, statistical models showed that individual preferences for partying did have a positive relationship the with reported level of collective effervescence at their campsite. However, the aerial measure of crowd density was a much stronger predictor of these reports—stronger than attendees’ own accounts of how often their camps were hanging out with others.

These results help us understand how collective effervescence happens, because they show how even just being near a crowd can “sweep people up” into a festive state. We often assume that crowds are stressful unless people choose to be in them or have positive, one-on-one interactions once inside. It is true that context matters—the grocery store queue probably won’t spark a party anytime soon—but this research shows the power of space and place for shaping our social lives.

Evan Stewart is an assistant professor of sociology at University of Massachusetts Boston. You can follow his work at his website, or on BlueSky.

In March, in an Instagram interview with Jameela Jamil, British pop star Sam Smith announced being non-binary in both gender and sexuality, stating “I’m not male or female. I think I float somewhere in between – it’s all on a spectrum” (timestamp 21:50 to 22.10). Smith had made a similar declaration to the Sunday Times in October, 2017, but did not suggest that the media use non-binary gender pronouns at the time. During the interview, Smith also revealed that “the basis of all my sadness” has been body shaming.

This instance of “biography and history” producing a non-binary person haunted by fat-shaming is important to the sociological understanding of gender. It reminds us that gender is lived in the body, not just as an idea but as a “looking-glass self” in which multiple kinds of stigma can simultaneously reduce a person to a “tainted, discounted one”. As culture shapes the way we see ourselves, it can produce an overpowering feeling of what Cooley called “mortification,” because “we always imagine, and in imagining share, the judgments of the other mind.” In Mead’s terms, culture produces this in the “generalized other”; how we imagine ourselves as an object in the eyes of the whole society. 

The intersection of body-shaming and transphobia shows us how bullying turns the body into an object. Jamil recounted in the interview that a photographer had called her a “fat c-word.” This can be compared with C.J. Pascoe’s famous study of how the word “fag” is used in bullying to police the gender of boys. Smith concludes the interview with a vow to promote self-forgiveness and the love of the body. This struggle against the gender binary fits within the mission of Jamil’s “I Weigh” instagram series seeking to resist all forms of cultural bullying and policing of bodies, gender expression and sexuality.

Jonathan Harrison, PhD, is an adjunct Professor in Sociology at Florida Gulf Coast University, Florida SouthWestern State College and Hodges University whose PhD was in the field of racism and antisemitism.

Black history in Appalachia is largely hidden. Many people think that slavery was largely absent in central and southern Appalachia due to the poverty of the Scots-Irish who frequently settled in the area, and who were purportedly more “ruggedly independent” and pro-abolitionist in their sentiments. Others argue that the mountainous land was not appropriate for plantations, unlike other parts of the South, and so slavery in the area was improbable.

A Sample Slave Schedule
(Wikimedia Commons)

As historian John Inscoe and sociologist Wilma Dunaway show us, this is not the case. According to Inscoe, slavery existed in “every county in Appalachia in 1860.” Dunaway—who collected data from county tax lists, census manuscripts, records from slaveholders, and slave narratives from the area—estimates that 18% of Appalachian households owned slaves, which compares to approximately 29% of Southern families, in general.

While enslaved people in the Appalachian region were less likely to work on large plantations, their experiences were no less harsh. They often tended small farms and livestock, worked in manufacturing and commerce, served tourists, and labored in mining industries. Slave narratives, legal documents, and other records all show that slaves in Appalachia were treated harshly and punitively, despite claims that slavery was more “genteel” in the area than the deep South.

My own research, which focuses on the life experiences of Leslie [“Les”] Whittington, whose grandfather was enslaved, helps to document the presence of slavery in Appalachia and the consequences that exploitative system had for African Americans in the region. Les’s grandfather, John Myra, was owned by Joseph Stepp, who lived in Western North Carolina. Census records show that Joseph Stepp owned seven slaves in 1850, five women and two men, who together ranged from one to 32 years of age. Ten years later, in 1860, schedules show Stepp owned 21 slaves, making him one of the wealthiest property owners in Buncombe County, the county in which he and John Myra lived.

Joseph Stepp was not unique. According to Dunaway, slave owners in Appalachia “monopolized a much higher proportion of their communities’ land and wealth” compared to those outside the area, driving wealth inequality in the region. Part of the legacy of slavery, these inequities remained in place after the Civil War, reinforced by Jim Crow legislation that subjugated African Americans socially, culturally, and politically. Sociologist Karida Brown explains how Jim Crow Laws led approximately six million African Americans to migrate from the South to the North between 1910 and 1970.

Poverty Rates in Appalachia by Race (U.S. Census Bureau, 2000).
Click to view report
Graphic by Evan Stewart

Those who stayed in Appalachia, such as John Myra and his descendants, faced continued restrictions, like living in racially segregated neighborhoods, having limited employment opportunities, and not being able to attend racially integrated schools. Such systematic forms of discrimination explain why racial disparities continue to exist today, even within a region where poverty among whites remains above the national average. To understand these existing inequities, we must document the past accurately.

Jacqueline Clark, PhD is a professor of sociology at Ripon College. Her teaching and research interests include social inequalities, the sociology of health and illness, and the sociology of jobs and work.