Search results for The

Brady sent me a link to a story in the Times Online about a poster put out by the British National Party, a right-wing anti-immigrant political party. Here’s the poster (found at the BNP website):

battle1

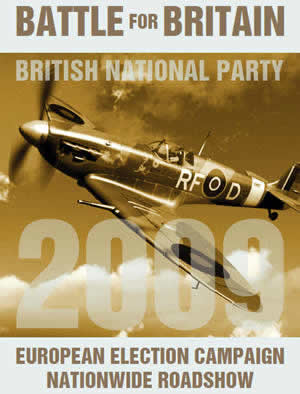
They’re clearly trying to connect efforts to defend Britain during World War II to the idea of a modern “battle for Britain,” which this time is against immigrants. However, they missed a detail when the chose the image for their poster, according to the Times story:

[The plane] could be clearly identified by its RF marking as belonging to 303 Squadron, an expatriate Polish unit, even though the BNP campaigns against immigration from Eastern Europe.

The BNP claims they knew it all along and did it on purpose; others believe they’re just trying to cover an incident that they find embarrassing.

Regardless, it brings up interesting questions about nationhood and definitions of who can be included in a country’s idea of its history. In the imagining of the BNP, would immigrants’ contributions be erased? Would they be acknowledged, but only as something that was appropriate and welcome in the past? After all, one of the very groups they’re vilifying played a role in defending Britain during the exact era that the BNP is trying to symbolically connect itself to. I suspect they might try to make an argument that the ex-pat Polish fighters were involuntary and temporary refugees that were being protected by Britain during a time of warfare and were in fact fighting to retake their own country, which is different than permanent immigrants who take British jobs and mess up the culture and whatnot, but that’s just a guess.

Of course, this isn’t something unique to the BNP; nativist groups everywhere face the problem of having to erase or explain away the contributions of groups they’re trying to exclude from citizenship.

Thanks for the tip, Brady!

The New York Times features an interactive graphic about the wage gap between men and women. It shows how different types of professions are distributed along the wage gap.  At the website, you can see click on each dot to see wage gaps for specific professions (e.g., female professors make 22% less than male professors).

capture31

Also about the wage gap, see posts herehere, here, and here.

Some people, especially men of color, report being harassed by police officers.  They often feel that police are not for them, as they are for some members of our society, but against them… making their lives more risky, more dangeous, even deadly.  Attesting to this, Jay at MontClair SocioBlog posted a graph he put together based on this article about the NYPD.  It shows that, sure enough, when the police stop people on the street in New York, it almost always results in… nothing:

00_nypd

See also this post that shows, with data, that racial profiling doesn’t work.

Fellow Contexts blogger Flaneuse over at Graphic Sociology posted this map showing increases in milk production by region:

milk_production_us

As we see, overall production has been more or less stable in most regions but has increased dramatically in the Pacific and Mountain regions.

This data hides another pattern, however: changes in average dairy herd size. Dairy operations in the West and Pacific regions tend to be significantly larger than dairy farms in the more traditional dairy states in the Great Lakes region and the Northeast. I went to the 2007 Census of Agriculture site and grabbed some data to do a few quick calculations. I chose two states in the western U.S. and two in the traditional Dairy Belt, just for illustrative purposes:

picture-18

All calculations use data available in Table 17 in the Census reports for the total U.S. and each individual state, which you can easily access at the link above if you want to check my numbers. I rounded everything off to the next highest whole number except for the two percentages in the lower right-hand cells, where doing so would greatly over-represent the percent of farms of that size.

In general, dairy farms with more than 500 milking cows are considered very large in the industry. Those with over 2500 cows are really extremely large, though there are dairies with more than 10,000 milking cows (including the Vander Eyk dairy, which supplies organic milk to be sold under the Horizon brand, as well as conventional, non-organic milk to other companies). But I digress.

Anyway, clearly we see that farms in California and Idaho (and the other Pacific/Mountain states) are larger, on average, than dairy farms in the traditional dairy states. The increase in milk production in the western U.S. is due predominantly to increases in the number (and herd sizes) of very large industrial dairies.

The growth of these large dairies depends on very cheap rates for water used to irrigate agricultural land. Those dairies have to grow lots of alfalfa and other feed crops to feed so many cows, since they certainly can’t afford enough land to have thousands of cows on pasture. And big dairies produce enormous amounts of manure that have to be carted off somewhere each day, meaning they often have big manure lagoons where they store it (as well as spraying as much as possible on fields). The lagoons are lovely, if you haven’t ever been really close to one, or perhaps nearly fallen into one while conducting research for your thesis. Not that I know anyone who has had such an experience. Point being, the competitive success of large western dairies is dependent on favorable political conditions (such as decisions to keep agricultural water rates lower than other water usage rates), and they have significant environmental consequences when we consider the use of water for irrigation in states that are often relatively arid and potential pollution from manure runoff.

I have some issues with Flaneuse’s implication that the growth of western dairies is a fairly natural result of population growth because milk is a localized commodity. I don’t know that you can really call milk a localized product these days–California milk is for sale in every state, and CA has aggressively marketed the state’s dairy industry with their “Happy cows” campaign. I can also buy milk from dairies in Minnesota here in Vegas, if I look a bit. So while I’m sure population growth has a role, I think it’s important to look at the political factors–particularly environmental laws as they apply to agriculture and local opposition to large dairies–that encourage the growth of huge industrial dairies in some regions more than others.

Also keep in mind, the production of milk when measured in pounds doesn’t just indicate there are more dairies or more dairy cows…it can also be the result of getting more pounds of milk per year per cow through the use of technologies such as bovine growth hormone (rBGH). I’m not up on rates of use of rBGH by region right at the moment, but I do know its use is nearly universal in industrial dairies; if smaller dairies in the midwest are less likely to use rBGH for various reasons (including concerns about customer opposition), that would also have an impact on where milk production is increasing most rapidly.

That was a lot of rambling to have just added one little image to what was in the original post at Graphic Sociology, but soc of ag is my specialty area and I geek out about it sometimes. You have no idea how much I reined myself in to tell you just this much about the dairy industry!

[Note: If you’re really super interested in this and don’t mind reading academic articles, I suggest an article by Jess Gilbert and Raymond Akor (1988) “Increasing Structural Divergence in U.S. Dairying: California and Wisconsin since 1950,” Rural Sociology 53(1): 56-72. They lay out some of the effects of politics, water subsidies, technological change, etc., and how they’ve favored a particular type of dairy system in the West. Also check out the Program on Agricultural Technology Studies at the University of Wisconsin, which has links to lots of easy-to-understand reports about trends in the dairy industry.]

Burk and Paul I.-M. both sent me this video that sums up the current credit crisis:

[youtube]https://www.youtube.com/watch?v=w4gcdQA33aI[/youtube]

It’s helpful for understanding the situation, but I can’t help pointing out a few issues, like the gendering–almost all the bankers, investors, brokers, and other members of the financial systems are male (I believe one of the investors was female). Also, I found the image of families interesting: “responsible” families are thin and have one kid while irresponsible ones smoke, drink, get fat, and have tons of kids.

Also, it didn’t explain too much about the types of loans made available to the subprime market, particularly the fact that monthly payments often went up significantly after a couple of years, so you might want to throw that in if you show the video–it wasn’t always that people got loans they couldn’t afford at the initial rate, it’s that when the interest rate changed and their payments increased, they couldn’t afford the higher rates. And of course many perfectly “responsible” families took subprime loans, planning on flipping the property for a nice profit, driving real estate prices up for everyone…and now often going into foreclosure along with everybody else.

Those caveats aside, it’s a pretty useful video for boiling down some basic causes behind the credit crisis.

NEW! (Mar. ’10): Caity sent in this video by Westpac, an Australian bank, in which they attempt to explain the credit crisis in a way that some have felt was self-serving and condescending. Caity explains,

Nearly all Australian home loans are on variable interest rates. Our reserve bank recently put up the national rate by 0.25%. Usually, the banks raise (or lower) their rates about in line with the reserve bank’s changes, but this time Westpac (one of our biggest banks) put theirs up by 0.45% – and then emailed this video to all of their home loan customers to explain why.


Gwen Sharp is an associate professor of sociology at Nevada State College. You can follow her on Twitter at @gwensharpnv.

Strawberry Shortcake socializes girls into a man-crazy, materialistic, mid-life disguised as liberation:

sweetinthecity

Via Jezebel.

Considering the graph below comparing the percent of GDP spent for economic stimulus during The Great Depression (1940s) and today (from the Tax Policy Center), Ezra Klein concludes:

We’re spending a lot right now, but this is hardly the most aggressive fiscal experiment in history.

federalspendingovertime

Contrast that summation with this ad from the American Issues Project:

[youtube]https://www.youtube.com/watch?v=eZ_Chroi4oc[/youtube]

This is what sociologists call a framing war.  Is the economic stimulus big or small?  You can make arguments either way, and people will.  The question is: Which frame will resonate more with (which members of) the American public?  We’ll have to wait and see.

(Via Alas A Blog.)

Lisa Wade, PhD is an Associate Professor at Tulane University. She is the author of American Hookup, a book about college sexual culture; a textbook about gender; and a forthcoming introductory text: Terrible Magnificent Sociology. You can follow her on Twitter and Instagram.

I’ve previously blogged about how, during World War II, Americans were expected to sacrifice in ways that we simply do not expect Americans to sacrifice today.  Specifically, my post addresses how people were encouraged to save gas and carpool (“Hitler rides in the empty seat!”), but people made all sorts of sacrifices: from going to work, to victory gardens, to eschewing panty hose.

Penny R. sent in another example that I found really interesting, staying off of phone lines during the hours when soldiers were likely to call home.  These government-sponsored ads were found in a 1944 Southern California Telephone Company phone books for West Los Angeles (found at This Book Is for You):

7_to_101

Text:  “Night-time is about the best time a service man has to call home.  That’s a good point to remember when you feel the urge to make a Long Distance call between 7 and 10 P.M.  If it isn’t important, we hope you won’t make it.   Let the men in service have first call on the wires.”

he_needs_phone_lines

Text:  “We appreciate the help you are giving us in keeping the Long Distance lines open for war calls.  The production of munitions . . . the movement of troops . . . the building of ships and bombers . . . have put the Long Distance lines squarely up against their biggest task.  Materials for building telephone lines are no longer available — they are needed on the fighting fronts.  That is why we ask that only really necessary calls be made to war-busy centers.  Thank you for your fine co-operation.”

war_and_long_distance

Text: “This year, war is on the wires.  And the Long Distance lines to war-busy centers must be kept open for calls that help to build planes and ships and move supplies and troops.  We cannot add to the lines–that would require the use of materials needed by our armed forces.  That is why we ask that only really necessary calls be made to war-busy centers.  Your co-operation means that we can do a better war job for you and for the Nation. Thank you.”

wartime_scarcity

Text:  “The trained eyes and fingers of telephone operators are needed, these days, at the switchboards that are heavily loaded with war calls.  Telephone equipment of every kind is deep in the war task.  Will you help us to make every bit of equipment count?  Here is one way: Please look in the Directory for any number you are not sure of.  Please look there first before you call ‘Information.’  Thousands of calls daily, in which ‘Information’ is asked to help, are for numbers that are IN the Directory.  Our foremost job is the war job. It just is not feasible to do all the things for our customers that we were able to do in peace time.  We appreciate your understanding and your friendly cooperation.”

Can you imagine being asked to stay off the internet every evening?  Impossible!!!