Search results for The

Enjoy a new round-up of examples in which men = people and women = women.  The tendency to include women as a special type of human being, alongside men who get to be regular people, is a specific example of a more general phenomenon in which some people, but not others, are marked as a specific kind.  We see this with race, routinely, in cases where there are “people” and “black people,” “families” and “ethnic families,” or when the skin tone of white people is substituted for the very idea of “skin” tone.  And we’ve covered many examples of this in regards to gender; see our posts on the Body Worlds exhibits, avatarsfitness equipment, rulers, and this collection of many additional examples.  Here is a new set of instances submitted by our Readers:

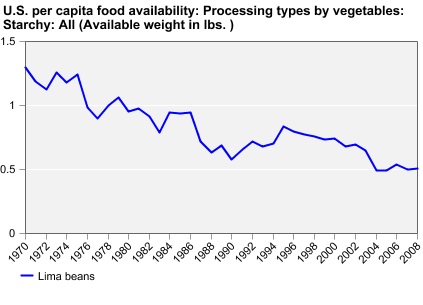
Michelle P. took this photo of two card games in Salem, MA at The House of the Seven Gables gift shop:


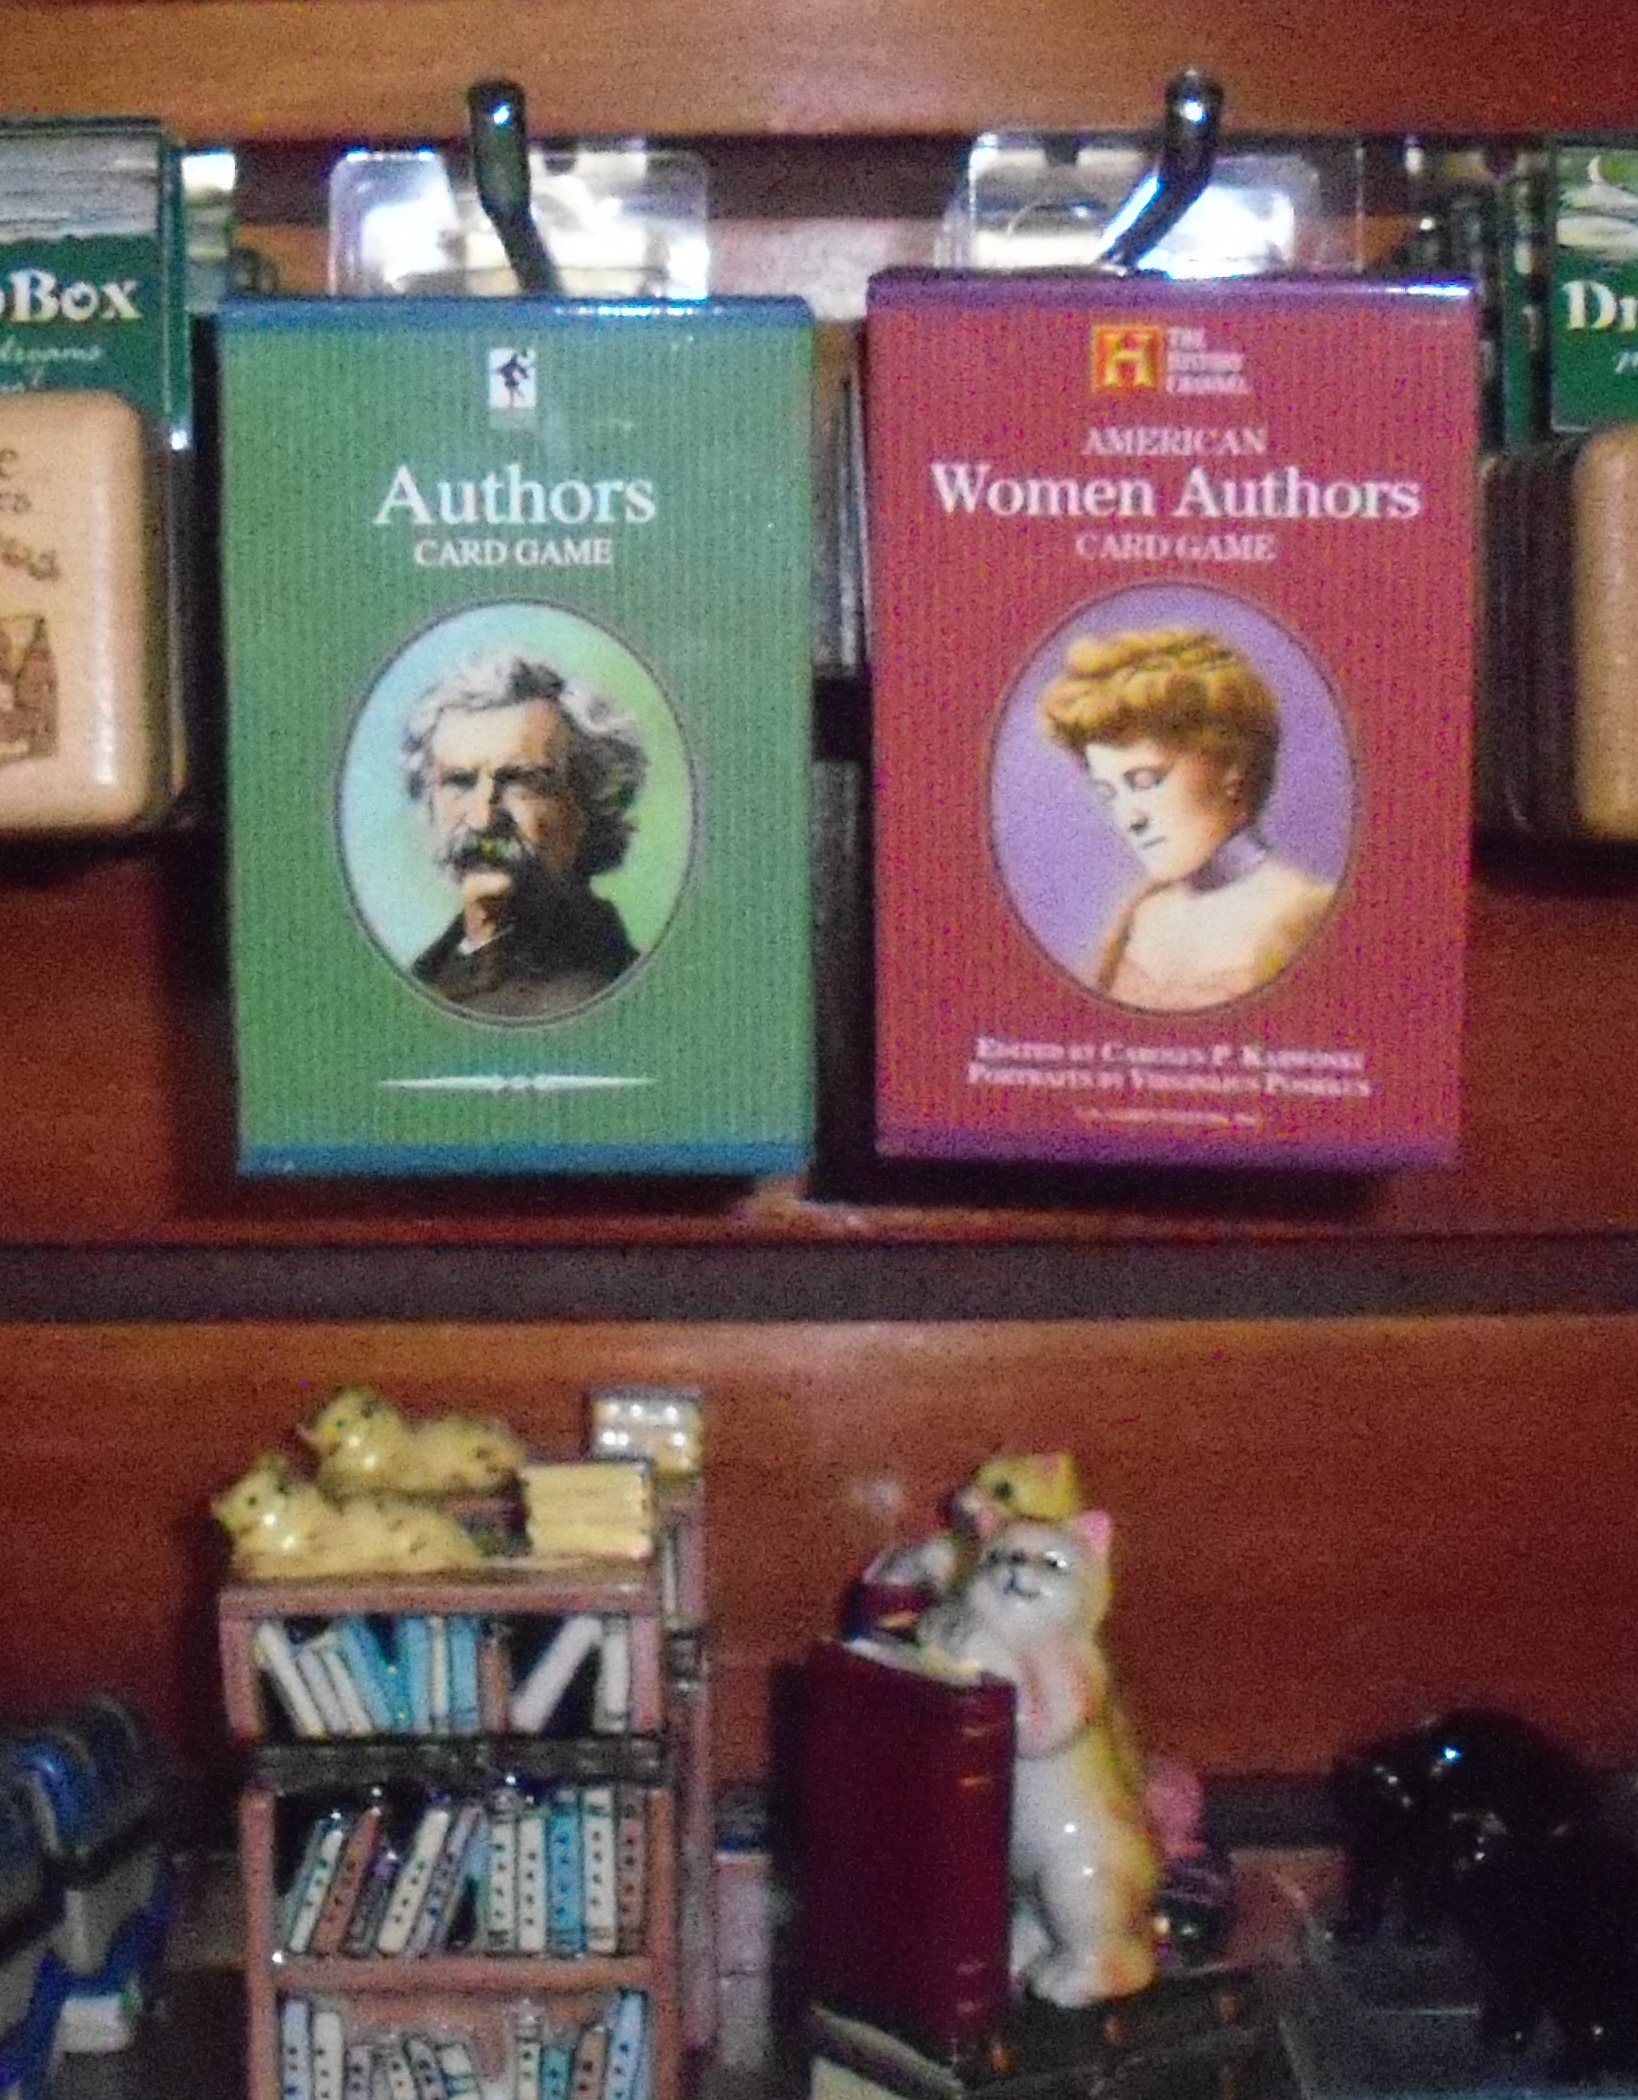
Jennifer discovered that her local zoo was selling “binoculars” and “girly girl binoculars”:

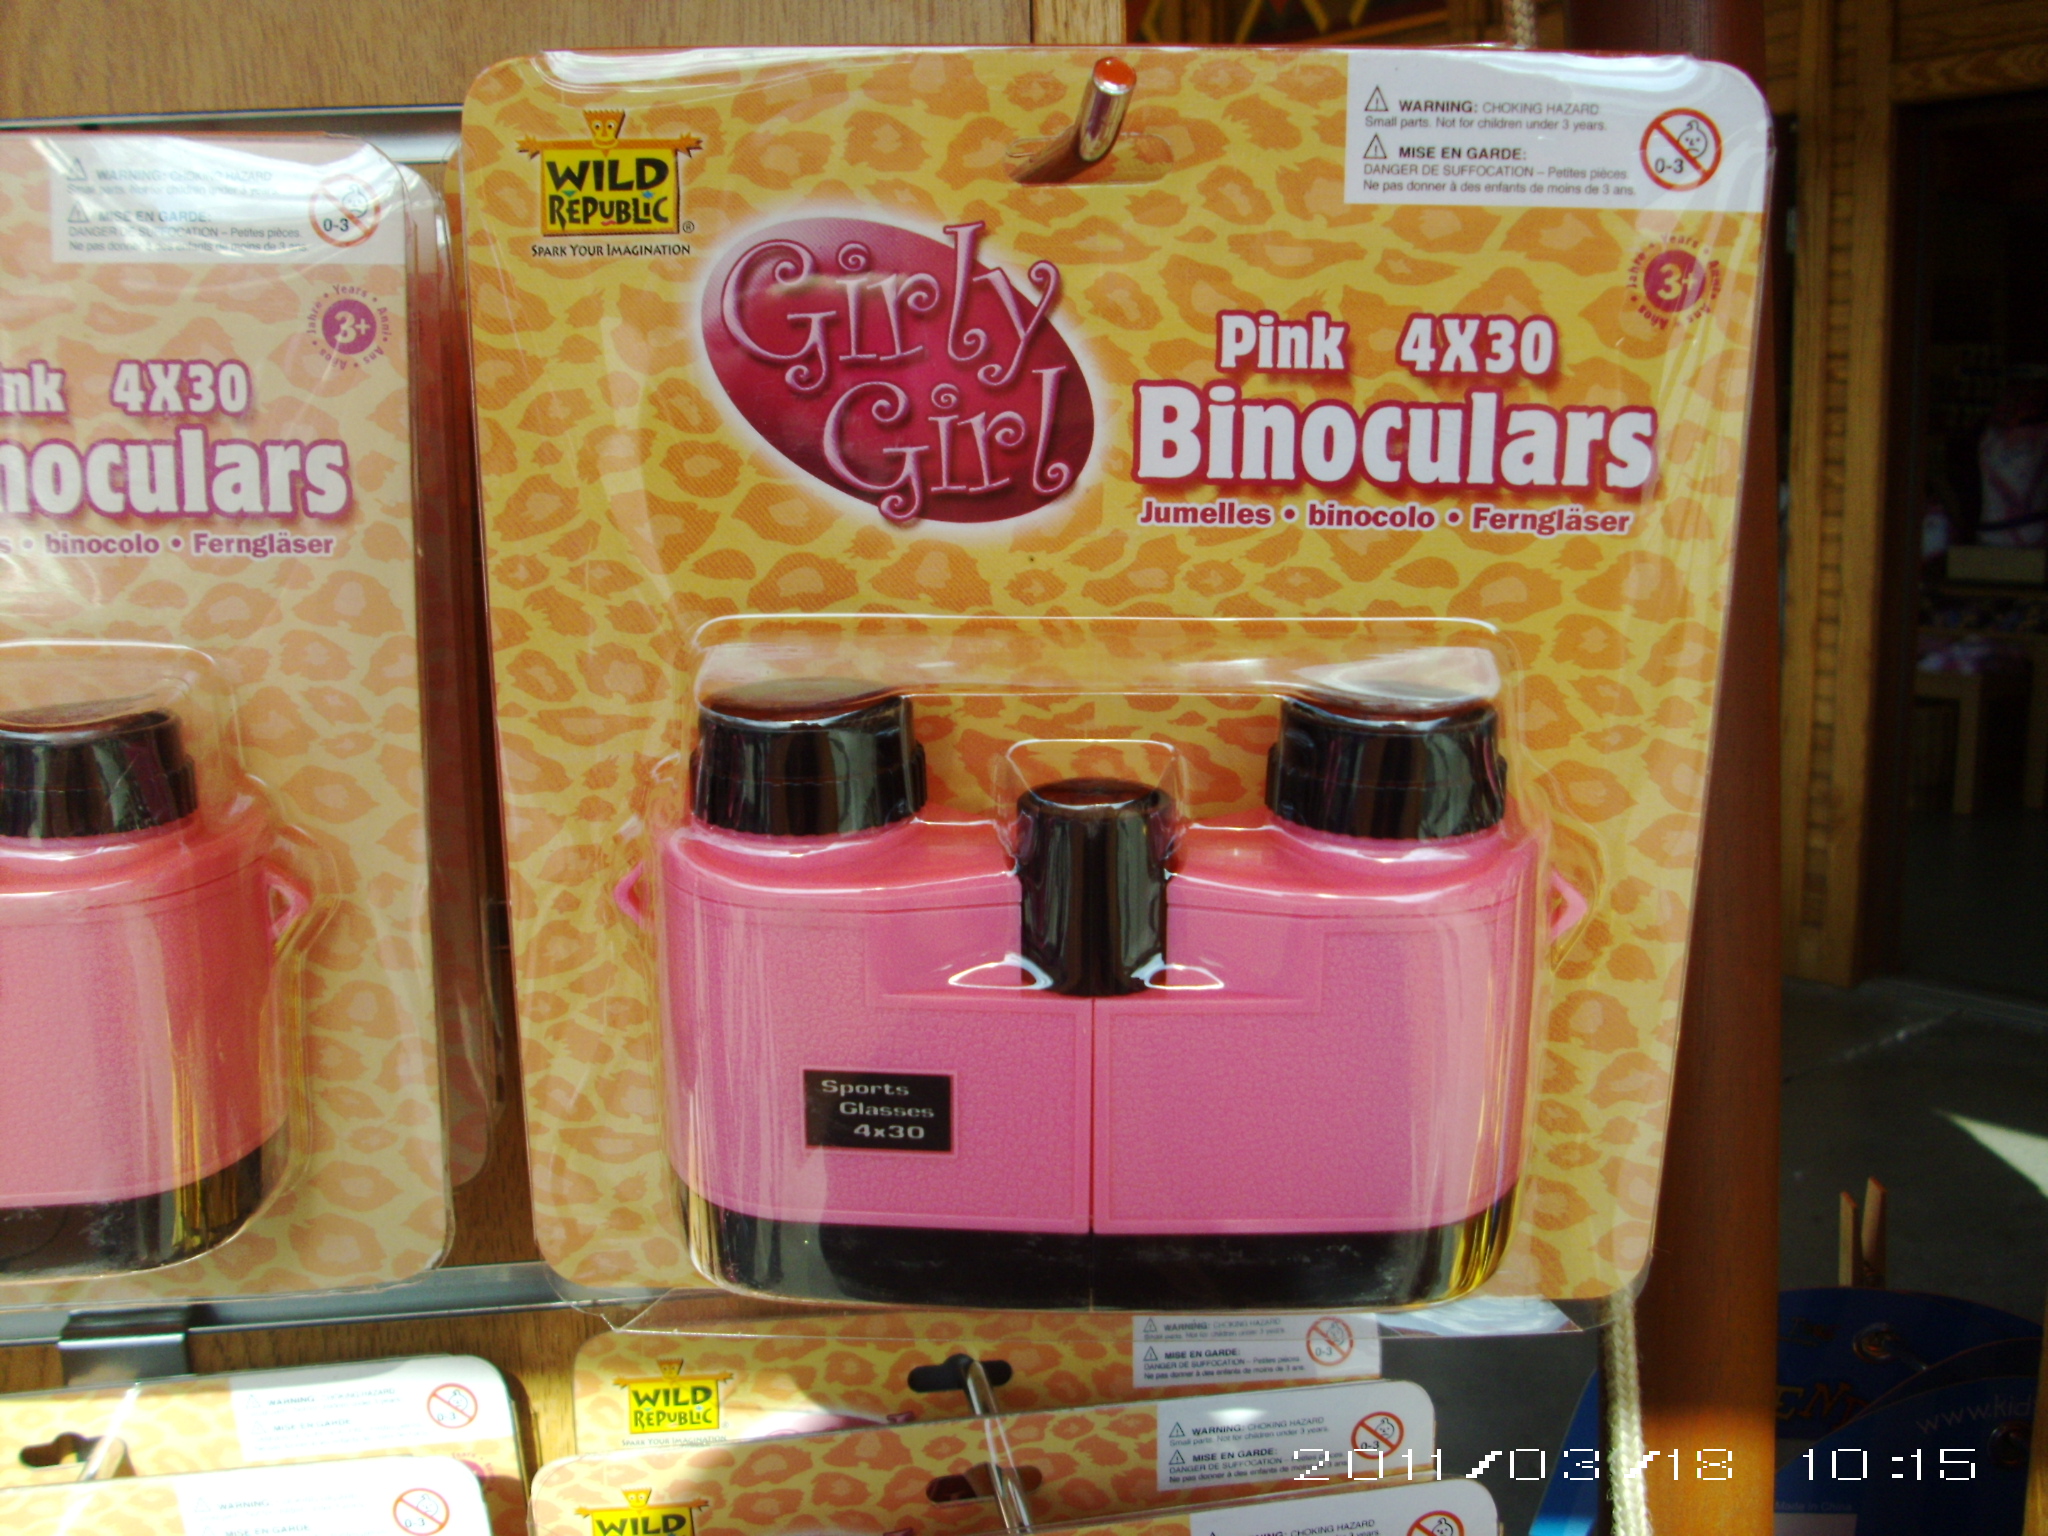
froodian sent along a set of guitar straps for sale.  There are “guitar straps,” “giggin for god guitar straps,” “kids guitar straps,” and “girls’ guitar straps” in pink, purple, and baby blue:

Sarah J. noted that the website www.healthcare.gov features sections (along the bottom) for “healthy individuals,” “individuals with health conditions,” and “women”:

Finally, Leigh sent along Technorati’s odd effort to appeal to women. Their main site has a highlighted yellow tab to press if you’re female, labeled “women.”  And, if you do, you get girly content, plus pretty flowers!

The main site:

The woman site:

Lisa Wade, PhD is an Associate Professor at Tulane University. She is the author of American Hookup, a book about college sexual culture; a textbook about gender; and a forthcoming introductory text: Terrible Magnificent Sociology. You can follow her on Twitter and Instagram.

A new publication from the CDC, sent along by sociology professor Sangyoub Park, reports that only 13% of households in the U.S. are still cell phone-free; meanwhile, 27% of households have now abandoned their landline telephone altogether.  The data, however, varies pretty tremendously by state.  Rhode Island and New Jersey have the lowest proportion of wireless-only households at 13%, while Arkansas leads with 35%:

For more detail, here are the states in order:

Dr. Park wondered if part of what was driving the state-by-state difference was levels of poverty.  Perhaps poorer families can’t afford both a landline and a cell phone and so they drop the former.  A rough comparison of the data with rates of poverty in various states is suggestive (source):

So that’s interesting.  But why does the CDC care?  One way to collect survey data is to get a random selection of Americans (or some subset) through random digit dialings. These, however, tend to exclude cell phones.  So the technological change is creating a methodological challenge.  Now scholars using random digit dialing have to consider how the exclusion of 27% of households with cell phones only skews their data, perhaps by disproportionately excluding the poor.  It’s a much more difficult case to make than when such methods excluded only the 2% of households with no phone service at all.

Lisa Wade, PhD is an Associate Professor at Tulane University. She is the author of American Hookup, a book about college sexual culture; a textbook about gender; and a forthcoming introductory text: Terrible Magnificent Sociology. You can follow her on Twitter and Instagram.

The new “manned-up” VW Beetle is in the news again and J. Dawn Carlson, a PhD Candidate at UC Berkeley, asked us to write about it.  We covered it in July of 2010, but figured this was a good excuse to revisit the post.

The VW Bug was introduced in 1938 for economical, powerful, fast, and sustained driving on the German Autobahn.  Later it jumped shores and became an icon of the California surfer lifestyle:

The New Beetle, however, introduced in 1998, quickly became associated with women because of its bubbly body and pastel colors. Feminized products, however, don’t sell well with men (or some women) because femininity is stigmatizing.  Accordingly, the Beetle is re-vamping its image; it’s getting a “sex change” for 2011.  Brit S. pointed us to a story in the Anaheim Examiner detailing this surgery.  Jim Cherry writes:

New Beetle is about to get a testosterone injection. A mean-looking chopped top, 200 H.P. motor, widened stance, and a larger interior will transform the quintessential chick car into a rock-hard rock star.

So being mean-looking, wider, and larger (with a Porsche engine) are all equated with masculinity, a characteristic that will supposedly improve the cars appeal to men (and non-girly women).  Here’s what the new testosterone-injected Beetle will look like (in red, of course):

Lisa Wade, PhD is an Associate Professor at Tulane University. She is the author of American Hookup, a book about college sexual culture; a textbook about gender; and a forthcoming introductory text: Terrible Magnificent Sociology. You can follow her on Twitter and Instagram.

Last week we received ten requests* to discuss the furor over a J. Crew ad featuring a 5-year-old boy in pink toenails, with his mom, Jenna Lyons, the President and Creative Director of J. Crew.

Fox NewsMedia Research Network Center (MRNC), and One Million Moms criticized the ad for supporting a liberal agenda aimed at mainstreaming gender-bending behavior and causing this particular child to be confused about his gender or sexual orientation.  Their criticism was picked up by mainstream news outlets, including ABCNewsThe Wall Street Journal, CNN, and the Los Angeles Times, who mostly just posed the question as to whether they were correct, while balancing opposing views in support of the idea that painting a son’s toenails pink was consequence-less.

Frankly, I’m not sure what to make of this “furor” (as I called it).  On the one hand, the criticism of the ad is a cautionary tale to all companies and a lesson to us all.  Here at SocImages, we frequently criticize companies that portray and assert rigid gender roles, especially for boys.  But look what happens when a company dares to do something different?  Outrage!  Accusations! Perhaps we’re short-sighted to imagine that companies can just tell whatever cultural story they want to tell.

On the other hand, perhaps this isn’t a story about advertising, perhaps it’s a story about media more generally.  It’s true that there were objections to the ad.  But I didn’t find many of them; just a few high-profile examples.  Perhaps what really happened was what is sometimes colloquially referred to as a “slow news day.”  Only the choir would have been preached to if the criticisms weren’t picked up and highlighted by many more media outlets.  And those outlets, as I did above, beg audiences to pay attention to the “furor.”  A furor that might have been largely of their own making.  Say “hello” to ratings.

These are my thoughts. Yours?

*  Many thanks to Katrin, Zoe S., Jeff H., Prof. Mary Reiter, Sara P., Andrew Slater, p.j., Brian K., Ben Y., and Dmitriy T.M. for the submissions!

Lisa Wade, PhD is an Associate Professor at Tulane University. She is the author of American Hookup, a book about college sexual culture; a textbook about gender; and a forthcoming introductory text: Terrible Magnificent Sociology. You can follow her on Twitter and Instagram.

Elyse Mc.D. sent in this graphic based on data from the Stanford Center for the Study of Poverty and Inequality that summarizes a number of aspects of inequality.

You can get a larger version here. I took screencaps of three of the figures I found most striking:

Via.


Katrin sent us a great example of anachronistic portrayals of Native Americans, this time in a German (?) ad for a muscle pain relief product. The slogan at the end, “Indians do not know pain,” plays on the idea of the stoic native:


Michel Foucault famously suggested that we stop congratulating ourselves for our willingness to talk about sex (“We are just so, like, liberated!”) and ask what it is exactly that we are saying. I thought of him as I pondered this 50-second compilation of each time a character in a single episode of the ABC Family show, The Secret Life of the American Teenager, utters the word “sex.” How many times?  70 times.  70 times in just 45 minutes of programming.

So we definitely know that we’re talking about sex.  That’s for sure.  But what is the impact of all of this talk?  You can imagine a thousand different messages contained in the space between one “sex” and the next.  Whether that’s liberating is up for debate.

Found at The Daily What.

Lisa Wade, PhD is an Associate Professor at Tulane University. She is the author of American Hookup, a book about college sexual culture; a textbook about gender; and a forthcoming introductory text: Terrible Magnificent Sociology. You can follow her on Twitter and Instagram.

Jeff H. sent in a link to a graphic at Civil Eats that lets you see the rise in U.S. daily caloric availability between 1970 and 2008, and where the additional calories are coming from. They are based on USDA data on food available for human consumption, minus what is wasted through being thrown out, spoiling before making it to the store, etc., to approximate average daily calorie consumption. It’s a rough measure, and clearly actual consumption will vary widely, but the overall changes provide some insights into the changing U.S. diet.

Note: I sometimes used the word “consumption,” “consumed,” etc., in the post since availability is an approximation of it, but as a reader pointed out, I should have been more careful, so I’ve fixed it throughout the post.

In 1970, we consumed had available an average of 2,168 calories per day, and the single largest source was meat/eggs/nuts:

By 2008, we had 2,673 calories available on average. The big jumps were in added fat — there are 231 more calories a day available per person, and it’s now the single largest source of calories — and grains. I was surprised to see how small the increase in added sugars was…and calories available from vegetables and dairy actually went down:

Overall, that’s an increase in available calories of 23.3% during this 38-year time frame.

You can go to the Economic Research Service website and create charts or tables of caloric availability for specific food groups. For instance, the chart on changes in sweeteners shows the jump in use of high-fructose corn syrup, and an accompanying decrease in dextrose:

There’s a lot less whole milk than there used to be:

But we’ve grown to love mozzarella and make a lot more of it:

Or instead of looking at trends over time, you can get the breakdown for one particular year. Here are the sources of our added fats for 2008:

Non-alcoholic drinks (excluding milk):

I warn you, this is one of those things where it seems like you’ll just look for a second, and the next thing you know you’ve spent 45 minutes making customized charts of every possible category of food.

Also, we do not like lima beans:

UPDATE: Reader Chorda provides some context that I think is helpful:

The added fat looks impressive, but because fat has 9 calories per gram that increase ends up only being 25.6 grams of fat over the 1970 amount, or 0.903013 ounce. Yes, less than an ounce of fat can add 231 calories. On the other hand, the additional grains and sugar combined would be 62.51 grams of carbohydrates, or 2.20497 ounces dry weight and 250 new calories from carbohydrate sources.

Just over three ounces of food can make a difference of 481 calories. Eating that extra 3.1 ounces every day for a week is 3,367 calories. One pound of fat is equal to 3,500 calories.

Take two tablespoons of oil. Combine with three tablespoons flour and one tablespoon sugar. That is the largest difference between 1970 and 2008. Could you even get a single pancake out of that?