
Jeff H. sent in a link to a graphic at Civil Eats that lets you see the rise in U.S. daily caloric availability between 1970 and 2008, and where the additional calories are coming from. They are based on USDA data on food available for human consumption, minus what is wasted through being thrown out, spoiling before making it to the store, etc., to approximate average daily calorie consumption. It’s a rough measure, and clearly actual consumption will vary widely, but the overall changes provide some insights into the changing U.S. diet.
Note: I sometimes used the word “consumption,” “consumed,” etc., in the post since availability is an approximation of it, but as a reader pointed out, I should have been more careful, so I’ve fixed it throughout the post.
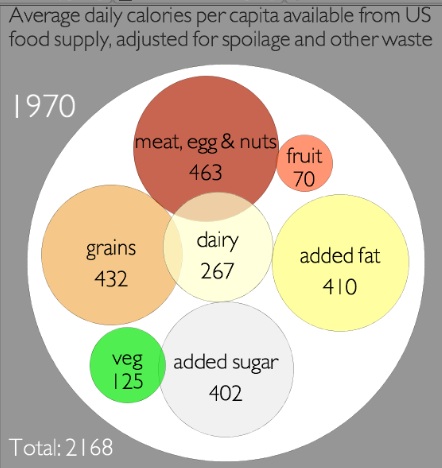
In 1970, we consumed had available an average of 2,168 calories per day, and the single largest source was meat/eggs/nuts:
By 2008, we had 2,673 calories available on average. The big jumps were in added fat — there are 231 more calories a day available per person, and it’s now the single largest source of calories — and grains. I was surprised to see how small the increase in added sugars was…and calories available from vegetables and dairy actually went down:
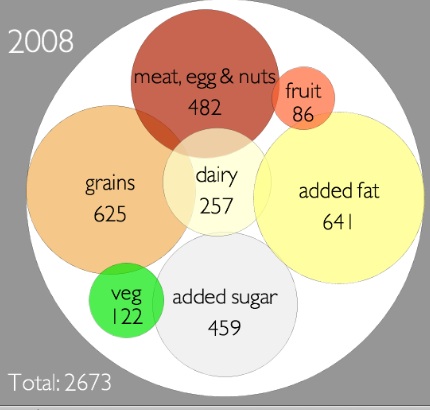
Overall, that’s an increase in available calories of 23.3% during this 38-year time frame.
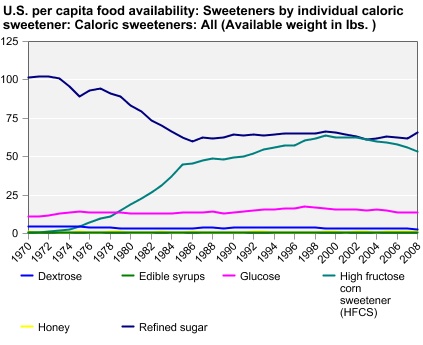
You can go to the Economic Research Service website and create charts or tables of caloric availability for specific food groups. For instance, the chart on changes in sweeteners shows the jump in use of high-fructose corn syrup, and an accompanying decrease in dextrose:
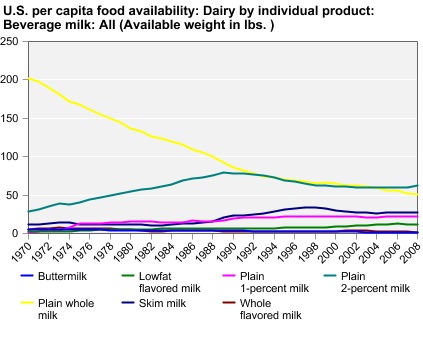
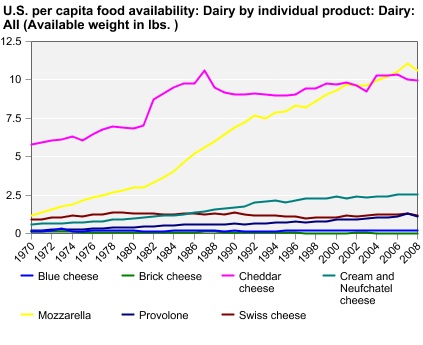
There’s a lot less whole milk than there used to be:
But we’ve grown to love mozzarella and make a lot more of it:
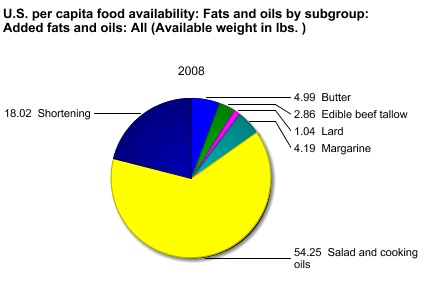
Or instead of looking at trends over time, you can get the breakdown for one particular year. Here are the sources of our added fats for 2008:
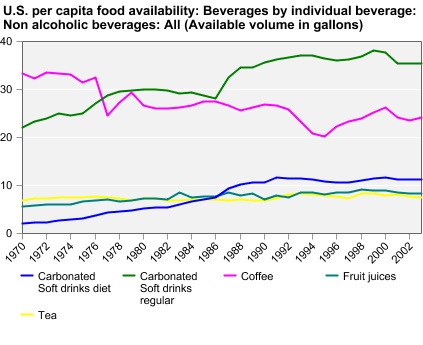
Non-alcoholic drinks (excluding milk):
I warn you, this is one of those things where it seems like you’ll just look for a second, and the next thing you know you’ve spent 45 minutes making customized charts of every possible category of food.
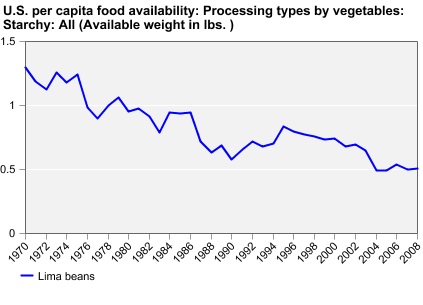
Also, we do not like lima beans:
UPDATE: Reader Chorda provides some context that I think is helpful:
The added fat looks impressive, but because fat has 9 calories per gram that increase ends up only being 25.6 grams of fat over the 1970 amount, or 0.903013 ounce. Yes, less than an ounce of fat can add 231 calories. On the other hand, the additional grains and sugar combined would be 62.51 grams of carbohydrates, or 2.20497 ounces dry weight and 250 new calories from carbohydrate sources.
Just over three ounces of food can make a difference of 481 calories. Eating that extra 3.1 ounces every day for a week is 3,367 calories. One pound of fat is equal to 3,500 calories.
Take two tablespoons of oil. Combine with three tablespoons flour and one tablespoon sugar. That is the largest difference between 1970 and 2008. Could you even get a single pancake out of that?
Comments 27
Emily — April 7, 2011
food "availability" is not the same as consumption is it?
Bob — April 7, 2011
Interesting post given the last one about childhood obesity.
The increase in average calories and the increase in average weights seem a plausible correlation, no?
All these extra calories and an increasingly sedentary lifestyle are not a worry though - apparently everyone is still healthy.
Chorda — April 7, 2011
The added fat looks impressive, but because fat has 9 calories per gram that increase ends up only being 25.6 grams of fat over the 1970 amount, or 0.903013 ounce. Yes, less than an ounce of fat can add 231 calories. On the other hand, the additional grains and sugar combined would be 62.51 grams of carbohydrates, or 2.20497 ounces dry weight and 250 new calories from carbohydrate sources.
Just over three ounces of food can make a difference of 481 calories. Eating that extra 3.1 ounces every day for a week is 3,367 calories. One pound of fat is equal to 3,500 calories.
Take two tablespoons of oil. Combine with three tablespoons flour and one tablespoon sugar. That is the largest difference between 1970 and 2008. Could you even get a single pancake out of that?
mllesatine — April 7, 2011
This seems like a pointless numbers game where none of the data is "real".
gasstationwithoutpumps — April 7, 2011
Bad color-coding on the graph has lead to mis-reading it. Dextrose has never been a big part of our diet. It is sucrose (refined sugar from sugar cane or sugar beets) that dropped from the first place, due mainly to price, with high-fructose corn syrup becoming cheaper and sucrose becoming more expensive.
The U.S. food supply, then and now | the lay gastronomer — April 7, 2011
[...] 2011 by hannah There’s an interesting post today from Sociological Images on how the U.S. food supply has changed over the past 40 years. If you’re a data geek, here is more information on how the USDA [...]
Brendan — April 7, 2011
because it made me curious...
1 4" Butermilk pancake
4g fat
11g carbs
So the 25.6g of fat is equal to a little more than thhe fat content of six 4" pancakes and the 62g of carbs is equal to just under the carb content of six 4" pancakes.
Marc — April 7, 2011
One veeery interesting breakout would be to see the calories consumed which are in processed vs unprocessed foods. It'd be tough to decide where the line is, (corn flakes are processed, but cake mix, maybe not, Plain yogurt vs Go-gurt?) but I would love to know how much of what we eat is prepared via basic ingredients, so that the eater has a shot of knowing what's in the food, vs say, Handi-Snax.
Waiting Room Reading 4/7 « Welcome to the Doctor's Office — April 8, 2011
[...] THE CHANGING U.S. FOOD SUPPLY by Gwen Sharp [...]
Suggestion Saturday: April 9, 2011 | On The Other Hand — April 9, 2011
[...] The Changing U.S. Food Supply. If only these graphs had compared eating habits across socioeconomic lines and with the habits of similar countries (Canada, for example!). Looking at what the “average” American eats is interesting but it’s hard to place these facts in context without more information. [...]
Rev C. — April 11, 2011
duh of course you can get a pancake out of that.
unless my pan is crap I wouldn't need more than 1 tablespoon of oil with that flour. And I don't need sugar on my pancakes. I think this may be part of the cultural differences in pancakes. Mine are thinner and lighter (UK) than the ones in the US, when I went to NYC I found your pancakes really weird, and sweet and filling.
do yours even have milk in them?
Changes in Available Calories in the US: 1970 - 2008 — April 14, 2011
[...] Sociological Images) [...]