Search results for survey

In the face of contentious debate about the value of guns, public health professor David Hemenway decided to have the experts weigh in. He modeled his research on the study of climate change experts that produced the familiar statistic that 97% of them believe that humans are causing climate change. He identified 300 scholars who have published about firearms in the fields of public health, public policy, sociology, and criminology. About 100 each have replied to nine surveys asking their opinions about common controversial statements.

Here is your image of the week:

12

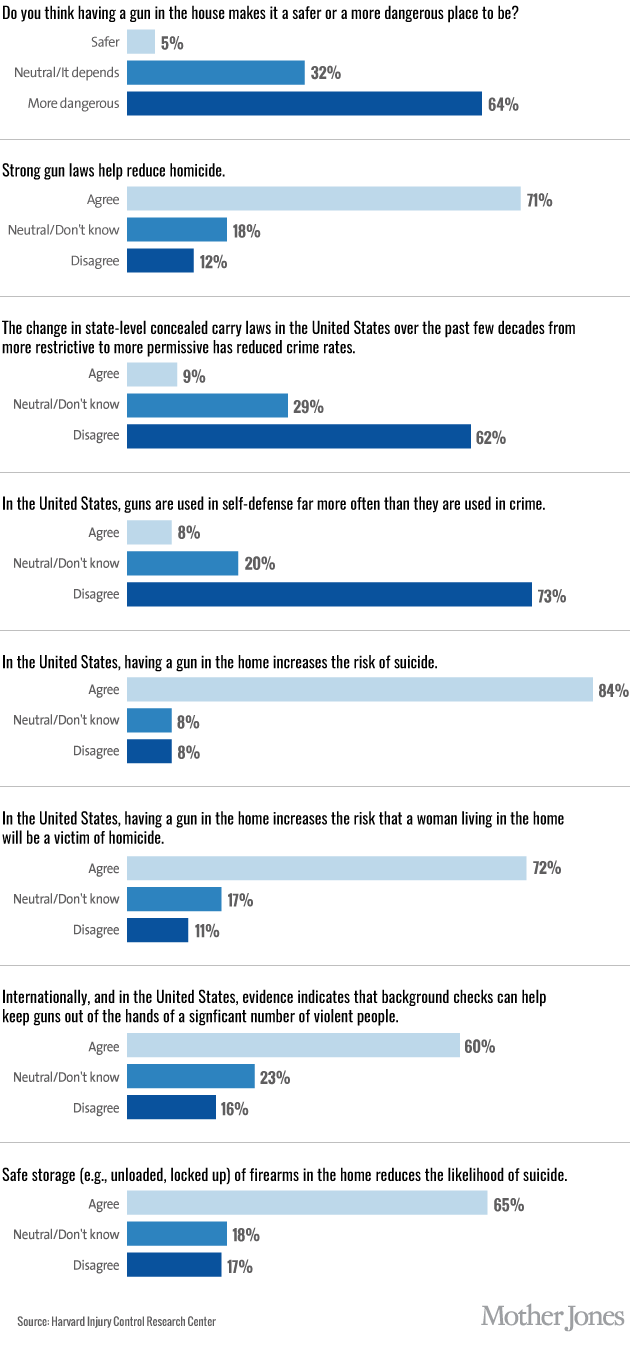
At Mother Jones, Julia Lurie writes: These data “show that a clear majority of experts do not buy the NRA’s arguments.”

Lisa Wade, PhD is an Associate Professor at Tulane University. She is the author of American Hookup, a book about college sexual culture; a textbook about gender; and a forthcoming introductory text: Terrible Magnificent Sociology. You can follow her on Twitter and Instagram.

The White House has made preventing sexual assaults on college campuses a priority, The Hunting Ground documents extensive institutional denial and malfeasance, the Department of Justice finds that one in five college women are assaulted, research shows that 1 in 25 college men is a serial rapist, and students at almost 100 campuses have filed federal complaints against their schools.

Yet, according to a study of 647 college presidents, only a third (32%) believe that sexual assault is prevalent on college campuses in general and only a tiny minority (6%) think it’s prevalent on their own campus.

13

This is stunning. Never before in history has the problem of sexual assault on campus been better documented. The media has never covered the issue so thoroughly, frequently, and sympathetically. We are in a moment of national reflection. Under these circumstances, a quarter of college presidents claim that sexual assault isn’t prevalent anywhere and 78% deny that it’s prevalent on their own campus.

These were confidential surveys, so impression management can’t explain these numbers. Those 94% of college presidents who don’t think that sexual crimes are prevalent at their schools either think the numbers are wrong, think their own institutions are exceptions, or think that one in five isn’t fairly described as “prevalent.” Or maybe some combination of the above.

No wonder faculty are frustrated and students around the country have felt forced to turn to the federal government for help. It’s clear. College presidents are either recklessly ignorant or willfully in denial — that, or they simply don’t believe women or don’t care about them.

Lisa Wade, PhD is an Associate Professor at Tulane University. She is the author of American Hookup, a book about college sexual culture; a textbook about gender; and a forthcoming introductory text: Terrible Magnificent Sociology. You can follow her on Twitter and Instagram.

According to a survey of 1,387 students in Sociology 101 classes at a large west coast university,  25.8% of college students “somewhat” or “strongly agree” that romantic love brainwashes women. Another 20% could be convinced.  Interestingly, the numbers were similar for men and women, though women were a bit more likely to agree.

8

Data from “Hey God, is that You in my underpants?” by Roger Friedland and Paolo Gardinali, published in Intimacies: A New World of Relational Life.

Lisa Wade, PhD is an Associate Professor at Tulane University. She is the author of American Hookup, a book about college sexual culture; a textbook about gender; and a forthcoming introductory text: Terrible Magnificent Sociology. You can follow her on Twitter and Instagram.

Flashback Friday.

The D.C. Council’s Committee on Health released a report after surveying high school students about sex education. One of their questions was about the source of sexual health information. The pie chart below shows that students name, in order, their parents or guardians, health workers, teachers, friends, and boyfriends or girlfriends as the most common sources of information.

Capture

I asked a similar question in a study I did with college students (full text). The students in my sample rated their friends, secondary school teachers, books, their sexual partners, and the media as their most important sources. Men also included pornography. Very few students counted parents among their most valued sources. (Significance indicators are for sex difference.)

Capture1

My co-authors and I were interested in how those sources correlated with actual knowledge, specifically knowledge about the clitoris. And so we gave them a “cliteracy test,” we had them answer a set of true/false questions about the clitoris and find it on a diagram of the vulva.

We then compared their scores on the test to their reported sources of knowledge. The table below is a regression showing which sources of knowledge were most predictive of a high score. The findings were interesting: only two sources predicted significantly higher scores on the test: media (for men and women) and self-exploration (for women).

Capture2

So, only one of the most frequently used sources of information, media, actually translated into real knowledge. And, ironically, the best source of information for women, their own bodies, was among the least often cited source of information for women, beating out only pornography and parents.

In other words, the best source of information about the clitoris is probably the… clitoris, but female college students would rather read books to learn about it.

This puts the D.C. study into some perspective.  The high school students in that study reported that their parents or guardians, health workers, teachers, friends, and boyfriends or girlfriends were sources of sexual information, but that doesn’t mean that they are good sources. It could be that they’re giving them misinformation or good information only about certain things.

Originally posted in 2009. You can see a summary of our findings on the correlation (or lack thereof) between knowledge about the clitoris and orgasm for women here.

Lisa Wade, PhD is an Associate Professor at Tulane University. She is the author of American Hookup, a book about college sexual culture; a textbook about gender; and a forthcoming introductory text: Terrible Magnificent Sociology. You can follow her on Twitter and Instagram.

Americans have become increasingly critical of public policy as a means of addressing social problems.  Many believe that these policies don’t work; the reality is that public policies are often subverted in ways that make them ineffective or even counterproductive.

Take taxes and inequality.  As Danny Vinik, writing in the New Republic explains:

The vast majority of Americans—both liberals and conservatives—believe that state and local taxes should also be progressive. That’s the finding of a new report released by WalletHub Monday. The researchers surveyed 1,050 Americans on what they thought the combined rate of state and local taxes should be at various income levels. Not surprisingly, liberals want the rate structure to be a bit more progressive than conservatives do, but their responses [as the following chart shows] were relatively similar:

1 (3)

However the reality is quite different.  State and local taxes are actually quite regressive.  The Institute for Taxation and Economic Policy studied the “fairness of state and local tax systems by measuring the state and local taxes that will be paid in 2015 by different [non-elderly] income groups as a share of their incomes.”  They did this state by state and, as presented below, on an overall basis.  As we can see, the lower the income, the greater the state and local tax burden.

1 (4)

Here are some of the report’s key findings:

  • Virtually every state tax system is fundamentally unfair, taking a much greater share of income from low- and middle-income families than from wealthy families. The absence of a graduated personal income tax and overreliance on consumption taxes exacerbate this problem.
  • In the 10 states with the most regressive tax structures (the Terrible 10) the bottom 20 percent pay up to seven times as much of their income in taxes as their wealthy counterparts. Washington State is the most regressive, followed by Florida, Texas, South Dakota, Illinois, Pennsylvania, Tennessee, Arizona, Kansas, and Indiana.
  • Heavy reliance on sales and excise taxes are characteristics of the most regressive state tax systems. Six of the 10 most regressive states derive roughly half to two-thirds of their tax revenue from sales and excise taxes, compared to a national average of roughly one-third . Five of these states do not levy a broad-based personal income tax (four do not have any taxes on personal income and one state only applies its personal income tax to interest and dividends) while four have a personal income tax rate structure that is flat or virtually flat.
  • States commended as “low tax” are often high tax states for low-and middle-income families. The 10 states with the highest taxes on the poor are Arizona, Arkansas, Florida, Hawaii, Illinois, Indiana, Pennsylvania, Rhode Island, Texas, and Washington. Seven of these are also among the “terrible ten” because they are not only high tax for the poorest, but low tax for the wealthiest.

In short, we know how to construct tax policies that can lessen inequality, but we’re not using state and local taxes to do it.

Cross-posted at Reports from the Economic Front and Pacific Standard.

Martin Hart-Landsberg is a professor of economics at Lewis and Clark College. You can follow him at Reports from the Economic Front.

Over the past 40 years, Americans have become increasingly likely to deny an affiliation with a religion. The graph below shows that people with “no religious preference” rose from about 5% of the population in 1972 to about 20% today. Overall, however, Americans do not report a corresponding decline in the a belief in God, life after death, or other religious ideas. What’s going on?

2

Sociologists Michael Hout and Claude Fischer — the guys who made the graph above — argue that the retreat from religious affiliation is essentially, a retreat from the political right. Religion has become strongly associated with conservative politics, so left-leaning people are choosing, instead, to identify as “spiritual but not religious.”

Here is some of their evidence. The data below represents the likelihood of rejecting a religious affiliation according to one’s political views. The more politically liberal one is, the more likely they have come to reject religion.

3

Using fancy statistical analyses, they explain: “generational differences in belief add nothing to explaining the cohort differences in affiliation.” That is, people haven’t lost their faith, they just disagree with religious leaders and institutions.  Hout and Fischer conclude:

Once the American public began connecting organized religion to the conservative political agenda — a connection that Republican politicians, abortion activists, and religious leaders all encouraged — many political liberals and moderates who seldom or never attended services quit expressing a religious preference when survey interviewers asked about it.

Democrats have wondered how to break the association of the right with religion and claim a little bit of moral authority for themselves. It looks like they may not need to or, even, that having failed to do so has a surprise advantage.

Lisa Wade, PhD is an Associate Professor at Tulane University. She is the author of American Hookup, a book about college sexual culture; a textbook about gender; and a forthcoming introductory text: Terrible Magnificent Sociology. You can follow her on Twitter and Instagram.

We have become more aware that Americans’ chances of upward economic mobility have for decades been a lot lower than Americans imagined, that being poor or rich can last generations. Efforts to explain that lock-in have pointed to several patterns, from the intergenerational inheritance of assets (or debt, as the case may be) to intergenerational continuity in child-rearing styles (say, how much parents read to their children). In such ways, the past is not really past.

Increasingly, researchers have also identified the places – the communities, neighborhoods, blocks – where people live as a factor in slowing economic mobility. In a post earlier this year, I noted a couple of 2008 studies showing that growing up in poor neighborhoods impaired children’s cognitive skills and reduced their chances to advance beyond their parents. In this post, I report on further research by NYU sociologist Patrick Sharkey (here and here) suggesting that a bad environment can worsen the life chances not only of a child, but that of the child’s child, an unfortunate residential patrimony.

Consider the ways that the immediate environment shapes a child’s development. It does so physically. Air and soil pollution, noise, and traffic, for example, measurably affect children’s health, stress, and cognitive development. Local institutions and resources, such as the policing, quality of the schools, availability of health services, food options, parks, and so on matter, as well. And the social environment may matter most of all. Growing up in a community with gangs, dangerous streets, discouraging role models, confused social expectations, and few connections to outsiders commanding resources is a burden for any child. Just getting by day-to-day can be a struggle. (In a pair of studies, Sharkey found that a violent crime occurring near black children’s homes in the days before they took a standardized test reduced their scores on the test, presumably because of anxiety and distraction.)

In their research on historical effects, Sharkey and co-author Felix Elwert used a survey that has followed thousands of American families since 1968 (the PSID). The researchers know much about the adults in the survey, including where they lived when they were around 16, about the children they had and where those children lived around the age of six. The researchers also have the results from cognitive tests administered to those children in 2002.

Sharkey and Elwert found that living in a neighborhood where 20 percent or more of the residents are poor — many other things being held constant (including the parents’ education, health, and attitudes) — seems to lower the test scores of children. And so does having a parent who grew up in such a neighborhood. The effect on children of living in a poor neighborhood and having parents who had also are substantially greater than the effect of only the second generation living in a poor neighborhood. Moreover, the children of two generations of poor neighborhoods do much worse than those of two generations who managed to stay out of poor neighborhoods (over half a standard deviation worse). For technical reasons, these statistical results probably underestimate the real effect of neighborhood poverty on scores.

What appears to have happened is this: Survey respondents in the first generation who grew up in poor neighborhoods ran higher risks than other respondents, on average getting less education and worse jobs, if any, and bearing more physical, social, and psychological problems. Not surprisingly, they tended to end up in poor neighborhoods as adults. When this first generation became parents, they commonly passed on some of their personal disadvantages, such as weak reading skills, to their own children. And they also passed on their places, raising the second generation in poor neighborhoods, which further hampered their children. In this way, Sharkey and Elwert argue, neighborhood problems dragged down (at least) two generations.

No discussion of neighborhood effects can ignore the racial dimension, because the residential segregation of blacks has been and, though reduced, continues to be extreme: 41 percent of the African-American parent-child pairs in the study grew up in poor neighborhoods in both generations; only 2 percent of white families did. Poor whites were less likely to live in concentrated areas of poverty and are more likely to get out of them if they did. The weight of the past is much heavier for some than others.

Claude Fischer is a sociologist at UC Berkeley, is the author of Made in America: A Social History of American Culture and Character. This post originally appeared at Made in America and was re-posted on the Boston Review BR Blog.

“We need to get rid of Obamacare,” says Ed Gillispie in a NYT op-ed. The reason: Obamacare’s “gravitational pull toward a single-payer system that would essentially supplant private insurance with a government program.”

Gillespie, who lays out his credentials at the start of the article – he ran for Senate in Virginia and lost – notes that Obamacare is unpopular. But he omits all mention of a government-run single-payer system that happens to be very popular – Medicare. No Republican dare run on a platform of doing away with it. Gillespie himself accused Obamacare of cutting Medicare, a statement that Politifact found “Mostly False.”

So how are seniors doing? Compared to their pre-Medicare counterparts, they are  probably healthier, and they’re probably shelling out less for health care. But compared to seniors in other countries, not so well. A Commonwealth Fund survey of eleven countries finds that seniors (age 65 and older) in the U.S. are the least healthy – the most likely to suffer from chronic illnesses.* 

Over half the U.S. seniors say that they are taking four or more prescription drugs; all the other countries were below 50%:

And despite Medicare, money was a problem. Nearly one in five said that in the past year they “did not visit a doctor, skipped a medical test or treatment that a doctor recommended, or did not fill a prescription or skipped doses because of cost.” A slightly higher percent had been hit with $2,000 or more in out-of-pocket expenses. 

In those other countries, with their more socialistic health care systems, seniors seem to be doing better, physically and financially.  One reason that American seniors are less healthy is that our universal, socialized medical care doesn’t kick in until age 65. People in those other countries have affordable health care starting in the womb. 

Critics of more socialized systems claim that patients must wait longer to see a doctor. The survey found some support for that. Does it take more than four weeks to get to see a specialist? U.S. seniors had the highest percentage of those who waited less than that. But when it came to getting an ordinary doctor’s appointment, the U.S. lagged behind seven of the other ten countries.

There was one bright spot for U.S. seniors. They were the most likely to have developed a treatment plan that they could carry out in daily life. And their doctors  “discussed their main goals and gave instructions on symptoms to watch for” and talked with them about diet and exercise.

Gillespie and many other Republicans want to scrap Obamacare and substitute something else. That’s progress I suppose. Not too long ago, they were quite happy with the pre-Obamacare status quo. Throughout his years in the White House, George Bush insisted that “America has the best health care system in the world.” Their Republican ideology precludes them from learning from other countries. As Marco Rubio put it, we must avoid “ideas that threaten to make America more like the rest of the world, instead of helping the world become more like America.”

But you’d think that they might take a second look at Medicare, a program many of them publicly support.

* Includes hypertension or high blood pressure, heart disease, diabetes, lung problems, mental health problems, cancer, and joint pain/arthritis.

Cross-posted at Montclair SocioBlog and Pacific Standard.

Jay Livingston is the chair of the Sociology Department at Montclair State University. You can follow him at Montclair SocioBlog or on Twitter.