Search results for census

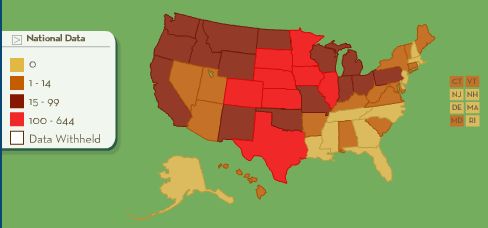
The US Census Bureau put together the map below.  It shows what percentage of households in any given county include a married couple.  In the counties colored with the darkest turquoise, between 59.6 and 79.6% of households consist of a married couple.  In the counties colored white, less than 51.6 do.

I think it’s interesting to speculate as to how the reasons why there are more or less married couple households might vary by place. For example, some places may have disproportionate numbers of gay and lesbian residents who cannot, legally, get married. Others may have higher rates of poverty, which has been shown to decrease relationship stability, leading to less marriage and more divorce.  Still others may have normative or religious pressures in favor of marriage (Utah strongly stands out as the most marriage-prone state).  The racial/ethnic make-up of counties may contribute to marriage rates; we know, for instance, that black women marry at a lesser rate than white women for a whole host of reasons.  Racial/ethnic homogeneity may play a factor too, since interracial marriage is still uncommon and asymmetrical when it does occur.  Some counties have more disproportionate ratios of males and females, which may also shape marriage rates. What do you think?  More hypotheses?  Arguments one way or another?

Lisa Wade, PhD is an Associate Professor at Tulane University. She is the author of American Hookup, a book about college sexual culture; a textbook about gender; and a forthcoming introductory text: Terrible Magnificent Sociology. You can follow her on Twitter and Instagram.

Please welcome Guest Blogger Philip Cohen.  Cohen is a sociology professor at the University of North Carolina at Chapel Hill where he specializes in studying the family.  We are pleased to reproduce a post from his own blog, Family Inequality, about (how statistics lie and) the recent media hype about the decrease in the divorce rate.

—————————————-

Delivering some “good news for Christmas,” The National Marriage Project, under the editorship of the sociologist W. Bradford Wilcox, has released a report titled The State of Our Unions, 2009: Money and Marriage. It has a lot of useful information on marriage and families, with some editorial bending in the pro-marriage-and-family direction.

My beef here is with the chapter titled “The Great Recession’s Silver Lining?” In it, Wilcox writes:

judging by divorce trends, many couples appear to be developing a new appreciation for the economic and social support that marriage can provide in tough times. Thus, one piece of good news emerging from the last two years is that marital stability is up.

That line was quoted by Ross Douthat at the New York Times, which is a shame, because there is no evidence about anyone’s appreciation for marriage in the chapter. Instead, the evidence for this assertion is presented in a graph that shows three data points in the divorce-rate trend:

The figure shows a decline in the divorce rate from 2007 to 2008. In the press release he calls that drop “the first annual dip since 2005.” (The rate shown here is divorces in a given year per 1,000 married women in the population that year.) Couple things:

1. There is no data point for 2006, so for all we know the divorce rate actually rose higher than it was in 2007, and started falling before the recession, which officially began in December 2007.

2. Despite the dramatic turnaround apparent in this graph, it’s really not enough to go on to draw the kind of conclusion he draws.

The second point is more important, because there really is a lot of research that shows job loss increases the odds of divorce. So why should this recession be different? It’s possible it is, but there’s no evidence – in this report or elsewhere that I’ve seen – of such a change.

In fairness, Wilcox wrote a column in the Wall Street Journal that musters some anecdotal evidence for his theory. But nothing to get him this far: “For most married Americans, the Great Recession seems to be solidifying, not eroding, the marital bond.” Even if the divorce did drop a little in one year – that doesn’t say anything about “most married Americans.”

That three-point graph is especially unfortunate because it leads to interpretations like this: “The divorce rate … had previously been on an upward path, rising from 16.4 divorces per 1,000 married women in 2005 to 17.5 in 2007.” That seriously misstates the real trend in divorce rates, which have actually been falling since 1981. And there is nothing in the trend to suggest that recessions teach couples a “new appreciation for the economic and social support that marriage can provide in tough times.” In the appendix, Wilcox presents that longer trend, which makes his previous figure seem much less dramatic.

(The graph seems a little off to me – notice how 10.6 is closer to the line for 10 than 14.9 is to the line for 15 – but I’ll work from his numbers below anyway.)

I think the story of a turnaround in divorce rates has traction because, like crime, divorce is one of those things many people assume is always getting worse (I see this in student papers frequently). So any decline in divorce rates looks like an important change.

What is recession’s effect?

I previously speculated that, because this recession was costing so many men their jobs, more men were likely to be become primary caregivers, and do more housework. The downside – I speculated – was that “maybe men getting ’stuck’ with childcare doesn’t bode well for marriages.” To support that speculation, I showed a graph of divorce rates that had little upward spikes during some recent recessions. The graph was not the real evidence for the argument – which was here:

We already know that economic hard times contribute to marital instability and divorce. Studyafter study after study have found that losing a job increases the likelihood of divorce, with some evidence that husbands’ losses matter more.

Here is a new graph I made, with the “crude divorce rate” (divorces per 1,000 people in the population) in blue, superimposed over Wilcox’s calculations in red. (His takes more work, which is probably why he doesn’t have it for every year. But they track quite well, with some pulling apart some after 1980, which has to do with changes in the population composition that probably aren’t important.) I also put the recessions on there, roughly, by hand with purple bars.

Source: Divorce rates from 2010 Statistical Abstract and various prior years; business cycles from 2010 Statistical Abstract.

Two things here:

1. Over the longer run, there is no obvious relationship between recessions and the divorce rate. There are big social forces at work here (like the rise of the legal practice of no-fault divorce, the increase in women’s education and employment, the growing tendency of men and women of similar education levels to marry, later age at marriage, more cohabitation and unmarried childbearing, etc.). But on the surface – which is where the Wilcox conclusion is drawn – there is not much to go on.

2. The crude divorce rate I got from the Statistical Abstracts shows a little peak in 2006 – not 2007 – followed by two consecutive years of decline, beginning before the recession. So rather than talk about the reason for the decline in the last year – which really just fits in with the falling divorce rates since 1981 – the anomaly is 2006. I have no explanation for that, but in the long run it probably doesn’t matter much.

On the other hand, the American Academy of Matrimonial Lawyers has surveyed its members twice since the recession started. In the first release last fall, they said 37% expected a drop in divorce filings, compared with 19% who usually see an increase during recessions. This fall they report that 57% of their members experienced a drop in filings, with just 14% seeing an increase. There are no details or methods reported in these releases, so it’s hard to evaluate. But if it’s true – along with the previous evidence that unemployment increases divorce – then it maybe that recessions delay the timing of divorce filings while increasing the divorce rate for those affected in the long run.

On the third hand, Jay Livingston at Montclair State points out that the NY Times reports that, in New York’s recession-year court backlog,  ”Cases involving charges like assault by family members were up 18 percent statewide.”

Whether delayed divorce filings contribute to family violence is a question someone might be able to answer when they put all this together. But I doubt the final word will end up as simple as, “Couples too broke to bicker,” as heartwarming as that is. There may be something to the speculation that falling home prices are stalling some divorce plans, but that is not quite the same as developing a newfound appreciation for the benefits of marriage.

I’m sticking with this: in hard times, families are a big part of how people make it through, but hard times are also hard for a lot of marriages. If it’s true that the husband’s job loss especially increases stress on a marriage – as previous research suggests – we may yet see that emerge for the current crisis. If not, maybe something has changed.

Lisa Wade, PhD is an Associate Professor at Tulane University. She is the author of American Hookup, a book about college sexual culture; a textbook about gender; and a forthcoming introductory text: Terrible Magnificent Sociology. You can follow her on Twitter and Instagram.

Robin L. sent us this great visual, from Flare (via), that uses U.S. census data to show how work type has changed over time.  The image below displays the percentage of men (blue) and women (pink) in each job between 1850 and 2000:

a

If you go to the interactive, you can see what percentage of all workers were of any given type, by sex, for each year.

You can also look at work by gender.  Look at how women’s participation in paid work has increased over time (but watch out for the shortened y axis):

aaa

The trend for men is down and I can’t think of a good reason for why (you?), though the source explains that some modern jobs are left out because they use occupational categories from 1950.

aa

You can also look at each job individually.  This is the image for farm laborers (again, with a short y axis):

aaaa

This data is great for comparative purposes, but leaves a bit to be desired in terms of capturing the whole picture because of the missing occupations.

—————————

Lisa Wade is a professor of sociology at Occidental College. You can follow her on Twitter and Facebook.

Andrew Gelman over at FiveThirtyEight posted a map (larger version here) that estimates support or opposition of groups with various characteristics to school vouchers, by state and broken down into five income groups. The overall national average is 45% in support of vouchers. Orange indicates that more than 45% of a particular group supports vouchers in that state, while green indicates that less than 45% support them. So, for instance, looking at row 2 (White Catholics), we see that as income goes up, support for vouchers in most states increases, particularly in the $150,000+ income group; on the other hand, row 4 shows much less overall support among White non-evangelical Protestants, even in the highest income group.

vouchermapsBAYES2000

Note that if a particular category (the characterstic for the row at any particular income level) makes up less than 1% of voters in the state, the state is left blank on the map. The data is from 2000, based on about 50,000 respondents. There’s a map of the raw data and a discussion of Bayesian statistical modeling in the original post, if you’re all into that.

As Gelman admits, he needs to add more details about what level of support/non-support the lightness or darkness of the colors indicate–what’s the difference between a very pale green and the darkest green? How many percentage points is that? However, the maps give a general sense of how different racial and religious groups feel about school vouchers, and how income influences that.

One thing I do have a problem with is that the categories are mutually exclusive, meaning Hispanic is treated as a race that does not overlap with Blacks or any of the subcategories of Whites (I also don’t know why all Hispanics and Blacks are put together in one category each). But most people labeled Hispanic in the U.S. see their race as White, with Hispanic as an ethnic, not racial, category–that is also how the U.S. Census defines “of Spanish origin.”

Environmental sociologists have noted that environmental toxicity is most concentrated in communities that include a disproportionate proportion of poor, working class, and non-white people. The map below compares the locations of toxic release facilities (green) with the percentage of people of color in neighborhoods in and near Los Angeles (yellow = 0-40 percent people of color; red = 80-100 percent of color).  The overlap is striking.
2651199629_ab93bd190f_o

Hat tip to Jose at Thick Culture.

Also in race and the environment, check out our post on the anti-immigrant/pro-environment movement, our post on lead poisoning and poor children, and our post on the use of American Indians as environment mascots.

NEW! Katherine O. sent us a link to a Canadian study showing how poverty and pollutants overlap in the city of Toronto. A map of air pollutants released from pollutant inventory facilities in Toronto in 2005, in kilograms:

picture-22

The green dots show where releasing facilities that must take part in the inventory are located; not surprisingly, there are more pollutants in areas with facilities. Of course, the siting of polluting facilities is often fraught with class and race issues, as we saw above.

There are three different measures of air pollution in the report, so you might check the others out too–this one is apparently conservative. While we can see here where there are higher levels of air pollutants, I couldn’t find in the report (which, granted, I didn’t read word-for-word) an absolute level above which pollution is considered harmful to human health, so this graph could be more helpful there.

Poverty rates in Toronto Census tracts, from 2001:

picture-33

From lightest to darkest, the ranges are 0.1 to 4.4%, 4.5 to 12.0%, 12.1 to 21.3%, and 21.4 to 72.8%. The overall Canadian poverty rate at the time was 11.8%.

Finally, neighborhoods defined as high in both poverty and pollutants (in 2005):

picture-41

Again, there are other maps showing overlaps of poverty and pollution when pollution is measured somewhat differently–I chose a more conservative one.

Katherine says,

I would add that these areas are also ones with a high proportion of recent immigrants and racialized individuals/families, although this is not shown.

Food & Water Watch has an interesting interactive map that allows you to click on states and see how many factory farms it has per county, broken down into cattle (meaning beef, I assume), hogs, dairy, broilers, and layers (the last two are both chickens). You can look at number of facilities or number of animals. Here’s a screenshot of the number of cattle containment facilities in the U.S.:

picture-1

Factory farms were identified using Census of Agriculture data and counting those that “best match the Environmental Protection Agency’s definition for a confined animal feeding operation…” based on the following guidelines:

picture-11

There’s a very detailed description of the methodology available here and an explanation of the maps here.

Yes, it’s another table from Nate Silver at FiveThirtyEight. He’s had some great stuff up lately. Here we have changes in compensation (per employee) between 1992 and 2007 for various industries, based on Bureau of Labor Statistics data:

finpay2

I do question some of these classifications–for instance, is “performing arts, spectator sports, museums, and related activities” really a coherent category? Nonetheless, it provides a relatively consistent measurement of compensation, which is useful for comparing change over time.

I wandered over to the BLS website and ended up on their Occupational Injuries and Illnesses page. There I discovered this in the National Census of Fatal Occupational Injuries in 2007:

picture-18

Along with the graph, we learn,

Workplace homicides involving police officers and supervisors of retail sales workers both saw substantial increases in 2007.

Police officers makes sense. But retail supervisors? Huh. I wonder what the actual numbers are.

From the same report we get the number and rate of fatalities by industry:

picture-19

The extraction industries (mining, forestry, farming, fishing, hunting) are noticeable outliers here, with significantly higher fatality rates (though not overall numbers) than any other industries.

So there’s some totally unconnected information about the labor force for you.

Racism is ingrained in the Midwest; we’ve normalized it. Take, for example, my earlier post on Tony Zirkle, the Chinese_stereotype.jpgHoosier Republican congressional candidate who spoke at a dinner honoring Hitler’s birthday. (He also publicly advocated for racial segregation.) Zirkle lost, of course, but the fact that he had no problem publicly stating his racism – without thinking that others would object – shows just how commonplace overt racism can be here.

One of the best examples is the “U-Washee” in Richmond, Indiana. The laundromat is, literally, built on racist stereotypes of Chinese people and no one gives it a passing glance. It’s 1940’s era cartoon stereotype mascot, what Margaret Cho calls “feng shui hong kong fooey font,” and the extra “ee”s at the end of words in the business’s name and posted notices all combine to form one hellish timewarp into a past America most areas have forgotten but we tend to accept as typical – and no one utters a peep.

Losing Sight of the Past

lost_clothes.jpg

While Americans tend to think of the South when the subject of racism comes up, the Midwest is no stranger to our own brand of anti-minority bigotry. The Klu Klux Klan was headquartered in Indiana for many years. The former national Grand Dragon, D.C. Stephenson‘s, home is blocks from mine; he more or less ran our state government in the 1920’s. One July 1923 Klan rally hosted by Stephenson in nearby Kokomo drew an estimated 50,000 people.

Bigotry flourished around the nation thanks to Stephenson’s efforts. He influenced governors, state legislators and congressmen. It wasn’t until he abducted, forcibly intoxicated, assaulted and raped a white neighbor woman who later died that he became a societal pariah. (One witness said her body looked like she’d “been chewed by a cannibal.” He was sentenced to life in prison.) No one knows if there were any African-American victims too; they were never considered.

Racism is part of our heritage too.

Don’t Get Too Worked Up

so_sorry.jpg

The reader who sent in these photos described his encounter at the laundromat. While he was taking the pictures, another customer walked up to him to ask, “You’re not from around here, are you?” It wasn’t meant in a threatening manner, but more of a bemused “Well, this is Indiana…” general excuse.

It’s often said that one thing Hoosiers fear most is change. We use it as a crutch to continue any bad behaviors we want to tacitly condone. Smoking rate too high? Our citizens are stressed over the economy. Rate of overweight people per capita one of the highest in the nation? It’s the diet. No protections whatsoever for gays and lesbians? These type of things take time.

Apparently almost 50 years isn’t quite enough.

Rewarding Bigotry

Chinese_reward.jpg

Another interesting aspect to this story is the financial angle. The unemployment rate in Richmond is 9.8%. Very few small businesses are succeeding. The “U-Washee” is entirely built around this racist theme and to remove the associations would cost a small fortune – new signage inside and out, a new name, changed business records with resultant legal fees, etc.

The owner is an elderly white man who’s barely making ends meet as energy costs and business expenses have skyrocketed while income has stayed the same. He’ll wash, dry and fold your clothes for you for $1 per pound. He provides a service the community needs. How do you wash your clothes if you don’t have a car to drive miles to another laundromat? There are three* other laundromats in the city of 40,000 people.

How does the community deal with the issue without cutting off their nose to spite their face in these desperate economic times?

Large Issues to Deal With

big_bundles.jpg

Confronting racism is never an easy task. Adding in poverty, employment and basic living issues only compounds the problem. If no one is complaining, why stir up trouble?

0.8% of Richmond’s population is Asian according to the US Census Bureau. They’re not complaining. The citizens obviously aren’t either. A quick Google search for “U Washee Richmond” shows exactly one relevant link – a listing for the pay phone. No other blog posts. No outrage in the newspaper. No protests outside the business.

What right do I have to interject myself in their affairs?

The Stain That Will Not Wash Away

rain_soft.jpg

I’ve not reached out to the “U-Washee” before posting these pictures and commentary. I plan to do it though, because someone has to speak up. I won’t demand or threaten. My goal is to help the owner move his business past the anti-Chinese racist stereotypes and not to shut the place down.

Someone has to speak up. Someone has to be first and break the cycle of complacency – the “I’m better than those poor deluded people” theory that too often excuses the continuation of prejudices and vices. Someone has to speak up.

Otherwise this stain will never wash away.

*Commenter AWB has pointed out that two laundries I thought were closed are open. I corrected the number of laundries in the town.

—————————-

Bil Browning is a long-time LGBT activist and writer.  He is the co-owner and Editor-In-Chief of The Bilerico Project – an LGBT political blog recently named one of four “must reads” by the Washington Post.  He and his partner, Jerame Davis, live with their teenage daughter in Indianapolis, Indiana.  We asked Bil if we could reproduce this post from his blog and he said “yes.”

If you would like to write a post for Sociological Images, please see our Guidelines for Guest Bloggers.