Search results for census

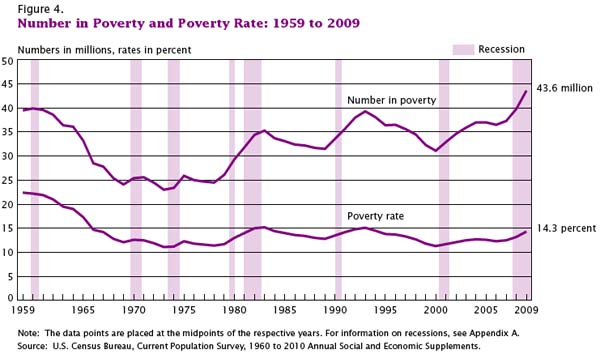
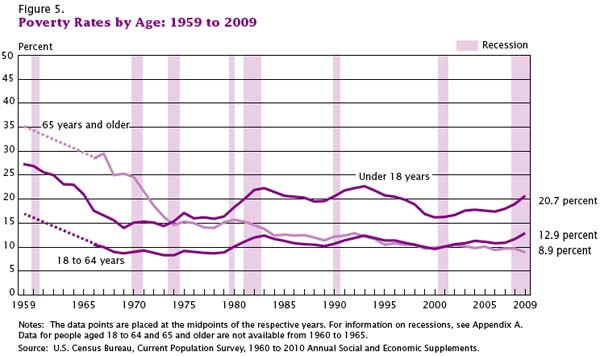
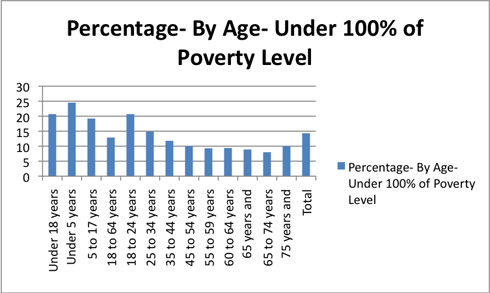
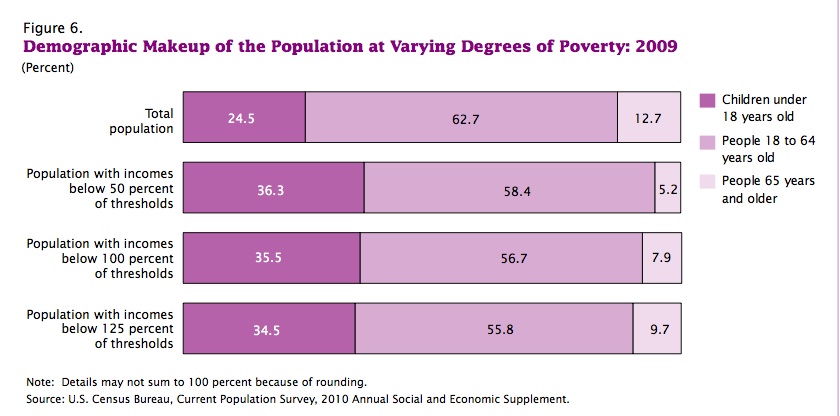
Rick T. sent in a link to a post at Global Research about some new U.S. Census data about 2009 poverty rates. As is usually true, children suffer higher levels of poverty than other age groups:

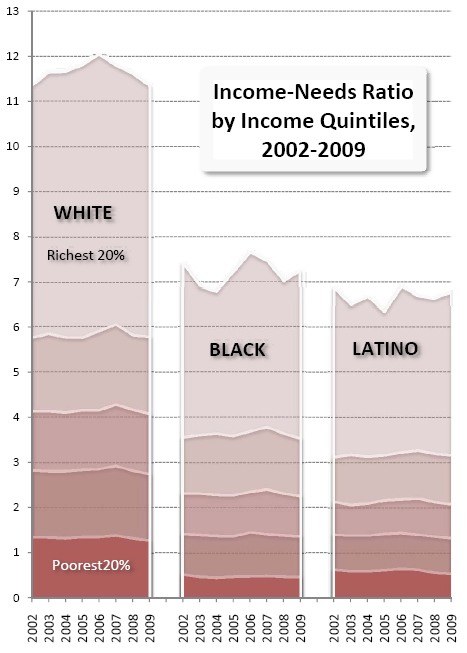
Poverty is significantly higher for African Americans than for the U.S. population overall — notice the Y axis goes up to 45%, whereas above it ends at 30%:
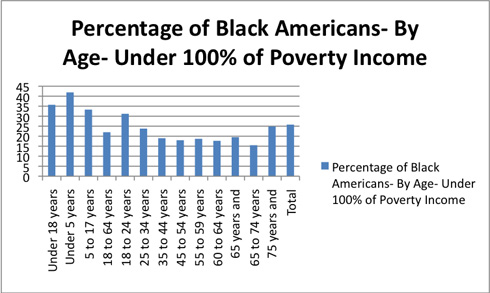
From the post:

Being American gives you a one in seven chance of being poor. Being young raises this chance to one in four. Further, being black in America means a one in four chance of being poor. Being young and black raises your chance of being poor up to one in 2.5.

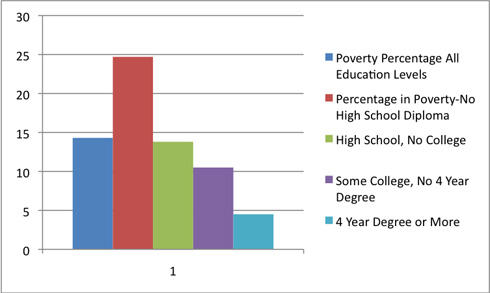
Not surprisingly, poverty is highly related to education level:

I went to the original Census report and grabbed some more images. This graph makes the over-representation of children among the poor even more obvious:

There’s tons of information in the report if you’re interested in the demographics of poverty in the current economic recession.

We know that U.S. stereotypes associate black people, especially black men, with criminality (for examples, see our posts on who looks suspicious, racial profiling, and race-sensitive trigger fingers).  But a new study by sociologists Aliya Saperstein and Andrew Penner shows that being convicted of a crime sometimes shifts people’s racial self-perceptions in related directions.  Saperstein and Penner compared the self-identification of people in 1979 and 2002.  Reflecting the social construction of race, it is typical for there to be some mis-matches between people’s reported race at different times; but the researchers discovered that the experience of being incarcerated shaped if and how one’s racial identification changed.

The Table below compares the self-reported race in 1979 (far left column) with the self reported race in 2002 (next left column).  The third and fourth columns show the reported race of people in 2002 who were not incarcerated and incarcerated, respectively.  We see that, among people who were not incarcerated, 5% of the people who identified as “European” in 1979 identified as “Black” or some other race in 2002.  Among people who were incarcerated, however, we see a much greater defection from whiteness; only 81% of those who identified as white in 1979 still did so in 2002.

Saperstein and Penner argue that this shows that “…penal institutions play an important role in racializing Americans…”  The experience of being incarcerated somehow makes people, even people who feel white, feel somehow less white.

Via Contexts Discoveries.  For great examples of the social construction of race, start with this simple lesson, then see these great posts: black and white twins! wha’!?, Obama looks just like his white grandfather, history and race in the U.S. census, claiming whiteness in court, judging racial phenotypes in China, and figuring out “Creole”.

Lisa Wade, PhD is an Associate Professor at Tulane University. She is the author of American Hookup, a book about college sexual culture; a textbook about gender; and a forthcoming introductory text: Terrible Magnificent Sociology. You can follow her on Twitter and Instagram.

Yesterday I posted the news that the percent of Americans in poverty reached nearly 15% in 2009.  Philip Cohen, at Family Inequality, used the same Census data to give us an idea of how both wealth and poverty are distributed across U.S. racial groups.  We know that Blacks, Latinos, American Indians and some, but not all, Asian sub-groups are poorer, on average, than Whites.  Cohen offers us a different way of looking at this, however, by plotting the income-to-needs ratio for Whites, Blacks, and Latinos over the last 8 years.

That income-need ratio is, by definition, 1.0 at the poverty line, and numbers above that are multiples of needs, so 3.0 is income of 3-times the poverty line.

That ratio sits along the vertical axis, with time at the horizontal:

This, Cohen explains, “…allows us to see the size of the White advantage…”  He continues:

So, for example, the richest 5th of Whites are above 11-times the poverty line, while the poorest 5th of Whites are (on average) just above the poverty line. In contrast, the richest 5th of Blacks and Latinos are around 7-times the poverty line, and 40% of both groups are below 1.5-times the poverty line.

It’s not simply, then, that Blacks and Latinos are disproportionately poor.  Their poor are also poorer than the poor Whites and their rich are less rich than rich Whites.

Lisa Wade, PhD is an Associate Professor at Tulane University. She is the author of American Hookup, a book about college sexual culture; a textbook about gender; and a forthcoming introductory text: Terrible Magnificent Sociology. You can follow her on Twitter and Instagram.

This week the U.S. Census Bureau reported that the American poverty rate has reached 14.3%, the highest it has been in 15 years:

Children are over-represented among the poor; among those  less than 18-years-old, the poverty rate is 20.7%:

The Census report suggests that the poverty rate would be even higher if it weren’t for an increase in non-nuclear family households.  Over the last two years, an additional 11.6 percent of households now include non-family or family members from three generations or more.  Consider this data from Philip Cohen’s Family Inequality blog (and notice that the near poor are more likely to be living with a grandparent than the poor, who may not have this option):

So, the economic recession is correlated with an increase in poverty, but what does “poverty” really mean?   The New York Times reports that in 2009 it meant a pretax income of $10,830 for a single person with no dependents and less than twice that, $22,050, for a family of four.

Trying to imagine keeping a roof over my head, sufficient food in my belly, and clothes on my back on that amount of money is difficult.  But even if this was possible, human beings  need more than food, shelter, and clothes.  Try to imagine, with this amount of money, maintaining friendships and romantic partnerships, nurturing your children’s emotional health and educational potential, having pride and comfort in your home and personal appearance, finding the resources to invest in your own human capital, or giving yourself a modicum of leisure.  Poor people are human too and these numbers only begin to scratch the surface of the kind of deprivation many Americans suffer every day.

Images borrowed from Graphic Sociology.

Lisa Wade, PhD is an Associate Professor at Tulane University. She is the author of American Hookup, a book about college sexual culture; a textbook about gender; and a forthcoming introductory text: Terrible Magnificent Sociology. You can follow her on Twitter and Instagram.

Abby Kinchy sent in a link to a story at Colorlines about where waste from BP’s Gulf oil leak is being disposed of. Nine landfills have been approved as disposal sites. Robert Bullard, who studies environmental racism (particular how toxic waste dumps are often located in neighborhoods where racial/ethnic minorities are over-represented), posted his calculations of the racial makeup of the areas surrounding these nine landfills over at Dissident Voices. This map from Colorlines shows the location of the landfills, the amount of waste (which includes “oily solids,” waste from the cleanup, and so on) sent there, and the percentage of people living within a 1-mile radius that are People of Color:

I looked up the % who aren’t non-Hispanic Whites for each state (as of 2008), just to provide some context:

  • LA: 38.1
  • MS: 41.3
  • AL: 31.6
  • FL: 39.7

So if we compare the neighborhoods simply to the % of POC in each state, there are 3 in LA, 1 in AL, and 1 in FL that have an over-representation of non-Whites and/or Hispanics. On the other hand, 3 landfills are in neighborhoods with racial/ethnic minority populations significantly below the state overall. This, of course, is a very rough measure, since different racial groups are not evenly spread across a state. I just wanted to provide at least some background info.

According to a story at the Miami Herald, operators of the landfills say there is no danger:

…operators of the landfills insist the BP garbage is not unprecedented and is suitable for the type of landfills they’ve selected: disposal sites that take household waste, as well as “special waste” like contaminated soil. They note much of the waste is generated by the cleanup operation itself: soiled cleanup coveralls, gloves, sandwich wrappers and drink containers.

They point out that the BP waste makes up a tiny amount of the material taken to these landfills each day.

However, residents are concerned because the landfills are regular municipal landfills, not designated for toxic waste (since the EPA has not categorized the waste as hazardous). The Associated Press discovered problems, including a truck that was leaking and left a trail of tar balls behind it, waste in containers that were not lined with the protective liners BP is supposed to use, and uncovered containers, including one in a state park that was leaking liquid from the previous night’s rain. The AP concluded, “…the handling and disposal of oily materials was haphazard at best.”

I’m not an environmental toxicologist, so whether or not the waste is hazardous or whether the landfills can keep it from seeping into groundwater is, obviously, beyond my ability to judge. I’m more interested in perceptions of risk and confidence in experts. There are distinct differences by gender and race, with women and non-Whites expressing higher concern about environmental pollution/dangers and higher perceptions of risk compared to men and Whites. In fact, White men stood out from all other groups, rating potential environmental risks significantly lower than every other group. In the U.S., the gender gap is not explained by differences in scientific knowledge.

Given these differences, discussions of environmental safety and risk are often very contentious. Experts in both the private and public sector are disproportionately White men. Regardless of scientific knowledge, they may underestimate the risks involved compared to how women with the same scientific knowledge would (I don’t have similar data on how scientific knowledge might affect the racial gap). Science doesn’t just provide us with objective facts; researchers and those applying their findings must interpret the data. Individuals with the exact same level of expertise may interpret the same data on the hazardousness (or lack thereof) of a particular type of waste very differently, without anyone being intentionally deceptive or more clearly biased.

And not all groups have equal faith in science or, more specifically, the people engaged in scientific research. Scientists in the 1800s used supposed objective measures to prove that Whites were superior to non-Whites (and, thus, to justify slavery) and conducted the Tuskegee Syphilis Experiment, in which they allowed Black men to suffer and die of syphilis just to see what happened despite having a cure available. And the hazards of materials or pollutants often aren’t immediately apparent and may become clear only later (or may differ for adults and children, or due to cumulative exposure over time, etc.), which scientific analyses may not predict.

I’m not arguing that scientists studying the toxicity of the BP oil waste don’t have any useful information about whether or not it poses any danger to human health, or that data doesn’t help us come to more accurate judgments than we would if we didn’t take such information into account. However, in situations such as these that may be framed, particularly by scientists themselves, as an example of uninformed public opinion vs. fact-based expertise, the differences in interpretations and the fears of local residents despite assurances by researchers may be based in a number of factors that make the story, and conflicts over perceptions of risk, much more complex than it might at first appear.

Sources:

  • James Flynn, Paul Slovic, and C.K. Mertz. 1994. “Gender, Race, and Perception of Environmental Health Risks.” Risk Analysis 14(6): 1101-1107.
  • Bernadette C. Hayes. 2001. “Gender, Scientific Knowledge, and Attitudes toward the Environment: A Cross-National Analysis.” Political Research Quarterly 54(3): 657-671.
  • Paul Mohai. 1997. “Gender Differences in the Perception of Most Important Environmental Problems.” Race, Gender & Class 5(1): 153-169.

Keeping a trend in perspective.

The sociologist down the hall pointed out that yesterday’s chart gave the impression of a whopping increase in TANF (Temporary Assistance to Needy Families) support for poor families. But I have been complaining since December 2008 that the welfare system is not responding adequately to the recession’s effects on poor single mothers and their children. I wrote then:

We now appear headed back toward a national increase in TANF cases. But the restrictive rules on work requirements and time limits are keeping many families that need assistance out of the program…. If the government can extend unemployment benefits during the crisis, why not impose a moratorium on booting people from TANF?

So it does seem contradictory that I would post a chart yesterday showing a huge increase in TANF family recipients, and continue the same complaint. So let me put it in better perspective. It’s a good lesson for me on the principles of graphing data, which I have made a point of picking on others for.

Height and width

There were two problems with yesterday’s chart. First, the vertical scale only ran from 1.6 million to 1.9 million families. Second, the horizontal scale only ran for 26 months. I’ll correct each aspect in turn to show their effects. Here’s yesterday’s chart:

It sure looks like a dramatic turnaround. And any turnaround is a big deal. I wrote last year:

What should be striking in this is that the rolls are increasing even as the punitive program rules continue to pull aid from families according to the draconian term limits dreamed up by Gingrich, ratified by Clinton and endorsed by Obama — 2 years continuous, 5 years lifetime in the program. The current stimulus package includes more money for TANF, to help cover an expected growth in families applying — but no rule change to permit families to keep their support in the absence of available jobs.

But, run the vertical axis down to zero, and the same trend is not so dramatic:

Now the big bounce since July 2008 is put in perspective. We’ve seen a 16% increase since that bottom point, but the response seems much more modest in light of the size and impact of the Great Recession we’ve come to know.

In fact, though, the longer-term view underscores how paltry that response has really been. Back the chart up to 1996, and you can see how small the increase has been compared with the pre-draconian reform period:

All three images are correct, but their emphasis is different. To me, the important take-home message from this trend is, “That’s it? The greatest economic recession since the Great Depression, and our welfare response was that measly uptick? Our system really is a shambles.”

One important issue remains, however, and that is some measure of the need for welfare. So consider the number of single-parent families below the poverty line, compared with the number of families receiving TANF (formerly AFDC):

Now the story is much more clear.

After welfare reform in 1996, the number of families receiving welfare was cut by half in just a few years. At the same time, however, the number in poverty dropped. Since then, as the number in poverty has increased, the number on welfare has not. The two trends appeared to be uncoupled through most of the 2000s. In the last year we’ve seen the first increase in TANF numbers since 1996, but nowhere near enough to meet the increase in poor single-parent families.*

It is still the case that, although the stimulus bill allocated more money to TANF, the punitive rules and term limits have not been changed. So the system does not address longer-term poverty — something we should expect to see much more of in the next few years.

*We don’t have the official 2009 poverty rates yet, since they are compiled from a survey done in March 2010, to be released this fall.

Philip Cohen, PhD, is a professor of sociology at the University of North Carolina at Chapel Hill, where he teaches classes in demography, social stratification, and the family.  You can visit him at his blog, Family Inequality, and see his previous posts on SocImages here, here, and here.

Lisa Wade, PhD is an Associate Professor at Tulane University. She is the author of American Hookup, a book about college sexual culture; a textbook about gender; and a forthcoming introductory text: Terrible Magnificent Sociology. You can follow her on Twitter and Instagram.

Rob D. sent along a commercial, made by the non-profit organization Iranians Be Counted, aimed at encouraging Iranian Americans filling out the U.S. Census to check “Other” and write in “Iranian.” It features a famous Iranian commedian doing a bunch of outrageous personalities, but in between the schtick is an argument that there is power in numbers and, therefore, a benefit to being identified as specifically Iranian:

This type of effort is really interesting and taps into a larger debate about Census categories.  How do we divide up the categories that we count?  Iranians are a much smaller group than, say, Arab American Persian (which is currently not an option on the U.S. Census).  If there is power in numbers, then wouldn’t it be better to write in “Arab American” “Persian”?  But, if you write in Arab Persian instead of Iranian, the resources to be gained from being counted may not benefit your community specifically. [As two commenters have pointed out, Iranian Americans are not Arab, except for a small minority. Iranians are Persian and most speak Farsi, not Arabic.  My mistake.]

The Asian American community in the U.S. is a good example of this conundrum.  “Asian” is a social construction; it is an umbrella label that includes very, very different groups.  There is great power in the social construction because it gives “Asians” a presence in American politics that, for example, the Hmong or the Vietnamese alone could never have.  But counting Asians as a group also means obscuring some very important differences among them.

For example, Asians outearn Whites in income surveys, suggesting that Asians should be excluded from programs trying to help groups escape poverty.  But, in reality, the groups we categorize as Asian vary tremendously in their average socioeconomic status.  Some Asian groups (e.g., the Japanese) outearn Whites; other Asian groups (e.g., the Hmong) have very high poverty rates.  When we look at the data broken out by smaller groups, we see more need, but the group itself is small enough that it can be ignored by politicians.

UPDATE: Roshan, in the comments, corrects me further:

Not all Iranians are Persians… Persians compose only 51 percent of the population. Other groups include the Azeris (24 percent), Gilaki and Mazandaranis (eight percent), Kurds (seven percent), Arabs (three percent), Lurs (two percent), Baluchs (two percent), and Turkmens (two percent) (Hakimzadeh, 2006).

Lisa Wade, PhD is an Associate Professor at Tulane University. She is the author of American Hookup, a book about college sexual culture; a textbook about gender; and a forthcoming introductory text: Terrible Magnificent Sociology. You can follow her on Twitter and Instagram.

It turns out that reports of white ethnic identification on the U.S. Census shift so dramatically over time, that simple demographic change cannot account for them.  Instead, (especially) white people, who can largely pick which of their ethnic ancestries to emphasize at any given time, are inconsistent.  Accordingly, ethnicities fall in and out of favor.  For example, German became quite unpopular during World War II.  Similarly, American Indian rose in popularity in the 1960s.  Today, many people proudly report their Irish ancestry, but there was a time in American history when one might keep it a secret if one could.

In Blue Collar Bayou, Jaques Henry and Carl Bankston III describe the recent resurgence of Cajun identification in Southern Louisiana.  They explain that, between 1975 and 2000, there was a 300% increase in the number of people who identify as Cajun.

Cajuns are a people who settled in Southern Louisiana after being exiled from Acadia (now Nova Scotia, New Brunswick, and Prince Edward Island) in the mid 1700s.  Mostly poor, for a very long time “Cajun” was a bad thing to be and negative stereotypes abounded.

Henry and Bankston explain that for most of their time in Louisiana, the portrayal of Cajuns was “solidly pejorative” (p. 65). They write:

Their Canadian origin, the dire circumstances of their settlement, and their early status as destitute refugees also set the Acadians apart from other white groups in Louisiana… [who] generally held higher socioeconomic positions… These groups… viewed the Acadian, and later Cajun, community as distinct and of little worth.

At the time, their food was described as “adequate.”

It wasn’t until the 1960s that these negative stereotypes started to change and now Cajun ethnicity, country, music and, especially, food is wildly popular:

5

Today Louisiana’s biggest problem isn’t getting people interested in Cajun food, it’s policing all the imitators.  Products labeled “Cajun” are so profitable today that the Louisiana legislature is trying to combat the “fake Cajun [product] problem” by using a logo on all Louisiana products that says “Product of Louisiana Certified Cajun“:

img9174962bec389b85

The new popularity of Cajun food can be attributed in part to efforts by the Louisiana tourism board and a handful of celebrity chefs, like Paul Prudhomme, who had the resources, skills, and business acumen to transform the food into a cuisine.

A nice example, I thought, of the social construction of both food and ethnicity.

Images here, here, and here.

Lisa Wade, PhD is an Associate Professor at Tulane University. She is the author of American Hookup, a book about college sexual culture; a textbook about gender; and a forthcoming introductory text: Terrible Magnificent Sociology. You can follow her on Twitter and Instagram.