Mark Thoma at Economist’s View posted the following graphical representation of changes in the age distribution of the population of the U.S. between 1950 and today, and projected to 2050:

agedist_9_19_05

The bump, slowly moving off to the right, is the baby boom generation. The downward slope in the lines as you move to the right represents a population with a larger percentage of older people or, in other words, an older average age. If the forecast is correct, about 10 percent of the U.S. population will be over 75 by 2050.

Mark observes that many examinations of historical trends likely need to take into account this changing age distribution. For example, he asks:

…with a larger and larger fraction of the population moving into the asset liquidation phase of their life-cycle, how is the saving rate affected? How much of the change in the saving rate in recent years is attributable solely to changes in the age-distribution of the population?

—————————

Lisa Wade is a professor of sociology at Occidental College. You can follow her on Twitter and Facebook.

Remember the hymen? The hymen is that flap of skin that “seals” the vagina until a woman has sexual intercourse for the first time. Supposedly one could tell whether a girl/woman was a virgin by whether her hymen was “intact.” (It bears repeating that neither of these things are true: it doesn’t “seal” the vagina and is not a sign of virginity at all.)

Because an intact hymen signaled virginity, and virginity has been considered very important, preserving and protecting the hymen was, at one time, an important task for girls and women. You can imagine how tricky this made the marketing of that brand new product: the tampon. Early marketing made an effort to dispel the idea that sticking just anything up there de-virginized you. It worked. (In fact, some partially credit tampon manufacturers for the de-fetishization of the hymen that’s occurred over the last 60 years.)

We still see tampon marketing addressing the question. Here’s a link to a website where it’s a FAQ and here’s an example of an advertisement from the ’70s ’90s:

virginad

Selected text:

I really wanted to use tampons, but I’d heard you had to be, you know, ‘experienced.’  So I asked my friend Lisa.  Her mom is a nurse so I figured she’d know.  Lisa told me she’d been using Petal Soft Plastic Applicator Tampax tampons since her very first period and she’s a virgin.  In fact, you can use them at any age and still be a virgin.

See this post, too, on the marketing of tampon to women in the workforce (wearing pants!) during World War II.

—————————

Lisa Wade is a professor of sociology at Occidental College. You can follow her on Twitter and Facebook.

Married women in the U.S. do about 70 to 80 percent of the housework. When women marry, the number of hours they spend on housework increases; for men, it stays the same. When couples have children, her housework increases three times as much as his. Feminist women do less housework than non-feminist women; men married to feminist women do the same amount of housework as men married to non-feminist women.

All this and more, including some data on Portugal, China, Russia, South Africa, Italy, Britain, and the Netherlands, can be found at this fact sheet at the blog Social Studies.

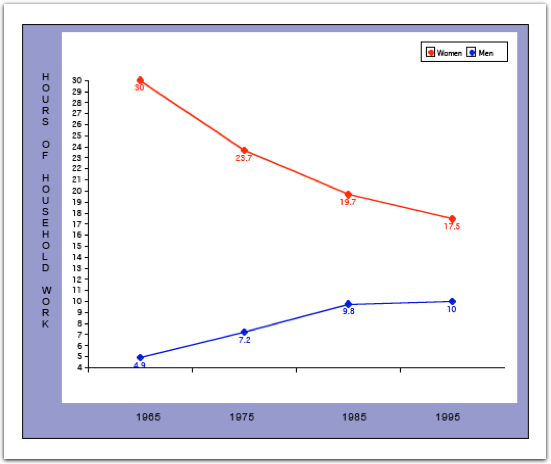
The discrepancy between the number of hours wives and husbands contribute to housework decreased between 1965 and 1995:

278457pastedimage3

According to the fact sheet:

…in the 1990s, U.S. women spent about half the time on housework as they had 30 years earlier (17.5 hours down from 30 each week), while men, on the other hand, were spending just over twice the time they had spent (10 hours up from 4.9).

Women, however, still do nearly twice the amount of housework as men.

You may notice that the increase in hours that husbands now spend on housework does not match the decrease in hours that wives now spend on housework.  This means that we have dirtier houses (no, really, we do).  We also now hire housecleaners, and that makes up some of the difference.  It may also be true that our gadgets (e.g., washers and dryers) save us time.

Relevant Links

Historical examples of the social construction of housework: husbands “help” wives by buying machines, gadgets replace slaves, feminism by whirlpool.

Contemporary cultural endorsements of the idea that men just don’t do housework (not so funny in light of the data): porn for women, men are jackasses, cleaning products are for women, men do housework fantasy calendar, KFC offers moms a night off, men are lazy oafs, and porn for new moms.

Also, women love to clean: cleaning is power, joy in cleaning, cleaning products are women’s special friend, and mmm, a new washer.

And, the intersection of housework, gender, and race: the color of housework.

—————————

Lisa Wade is a professor of sociology at Occidental College. You can follow her on Twitter and Facebook.


The recent federal bailouts have drawn attention to CEO compensation. The screenshots below, taken from the New York Times, show what that compensation looks like for specific CEOs and the change in compensation between 2007 and 2008. Click over to the source for many more examples, company performance data, and methodology.

1

3

4

5

6

—————————

Lisa Wade is a professor of sociology at Occidental College. You can follow her on Twitter and Facebook.

Headlines across the country recently noted that more Americans now consider themselves “pro-life” than ”pro-choice”. In the last month many polls have focused on Americans’ views on abortion, yet the Gallup poll released on May 15, 2009, got the most attention. President Obama was just about to give the commencement address at Notre Dame where a controversy had erupted; critics complained that a pro-choice politician should not have been granted an honorary degree at a Catholic institution.

The Gallup poll graphs below show the new divergence of opinion. Looking at the pattern over time, it is clear that opinions of pro-choice versus pro-life have been changing, although the trend between 1998 and 2008 is not remarkable in its variety. The change that the news signaled is that last switch in the apparent prevalence of pro-life opinions.

clip_image001

Sociologically, let’s look at this issue more closely. Opinions on abortion, its availability, one’s identification with the issue, and its legality are sensitive and controversial because they involve religious, political, and cultural values and very personal, often difficult situations.

Polls show a variety of support depending on the wording of the questions. Look at the poll results from the last month:

Gallup Poll (May 7-10, 2009. N=1,015 adults nationwide. Margin of Error ± 3).

“Do you think abortions should be legal under any circumstances, legal only under certain circumstances, or illegal in all circumstances?”

Legal Under any Circumstance Legal only under Certain Circumstances Illegal in all Circumstances Unsure
22% 53% 23% 2%

Quinnipiac University Poll (April 21-27, 2009. N=2,041 registered voters nationwide. Margin of Error ± 2.2).
“Do you think abortion should be legal in all cases, legal in most cases, illegal in most cases or illegal in all cases?”

Always Legal Usually Legal Usually Illegal Always Illegal Unsure
15% 37% 27% 14% 7%

The wording of the questions are only slightly different (circumstances versus cases) yet the results are quite different. Note that a only a minority hold that abortions should always be illegal. “Identity” issues also frame the debate. As the following polls show, when asked whether they consider themselves pro-life or pro-choice, respondents offered slightly different results.

Here’s something sociologists need to consider: We don’t know whether these differences are statistically significant. This rather important issue is not addressed in news reports on the Gallup Poll. It may be that we have equal percents of people in each category and the oscillations over time are not statistically significant. At the very least, the reported margin of error (MoE) shows that the percent of people in these groups may not be so different after all.

FOX News/Opinion Dynamics Poll (May 12-13, 2009. N=900 registered voters nationwide. MoE ± 3).

“On the issue of abortion, would you say you are more pro-life or more pro-choice?”

Pro-life Pro-Choice Both/Mix Unsure
49% 43% 6% 2%

Gallup Poll (May 7-10, 2009. N=1,015 adults nationwide. MoE ± 3).

“With respect to the abortion issue, would you consider yourself to be pro-choice or pro-life?”

Pro-choice Pro-life Mixed/Neither Don’t Know What Terms Mean Unsure
42% 51% 2% 4% 1%

CNN/Opinion Research Corporation Poll (April 23-26, 2009. N=2,019 adults nationwide. MoE ± 2).

“With respect to the abortion issue, would you consider yourself to be pro-choice or pro-life?”

Pro-choice Pro-life Unsure about Terms Mixed/Both/Neither Unsure
49% 45% 1% 3% 1%

Another way to look at abortion opinions is to ask about people’s legal opinions as this poll does. The CNN poll below asked specifically about the Roe v. Wade decision. Even if more people might identify themselves as pro-life, there is still a preponderance of support for the Supreme Court decision.

CNN/Opinion Research Corporation Poll (May 14-17, 2009. N=1,010 adults nationwide. MoE ± 3).

“The 1973 Roe versus Wade decision established a woman’s constitutional right to an abortion, at least in the first three months of pregnancy. Would you like to see the Supreme Court completely overturn its Roe versus Wade decision, or not?”

Yes, Overturn No, Not Overturn Unsure
30% 68% 1%

Here’s another piece of data to consider – the actual trends in abortions. Since the 1980s, the rates have leveled off thus abortion has not increased in use. The fact that it is has been decreasing and not increasing might lessen opinions about its availability.

clip_image002

To better understand how the pro-life and pro-choice opinions may be changing; take a look at these graphs from the Gallup poll and notice which lines are moving in which direction.

clip_image003

clip_image004

clip_image005

It seems pretty clear that more conservative, moderate, and Republican people are leaning more pro-life than they were in years past. How might we explain this? Republican leaders have stressed this issue in their attempt to solidify opposition to the Obama administration and the gains made by Democrats in the House and Senate.

From a sociological perspective, we can see that this issue is much more complex than a single headline. Before we can conclude that social change is happening, we need to examine the data available and whether our findings are statistically significant. What other methodological questions do you think we need to ask to better understand trends in public opinion?

————————–

Sally Raskoff is a blogger at the Everyday Sociology Blog and is an Associate Professor of Sociology at Los Angeles Valley College. One of her main goals in life is to demystify society through the use of sociology.

If you would like to write a post for Sociological Images, please see our Guidelines for Guest Bloggers.

I’m not quite sure what to make of this but, after clicking through this Time magazine slide show of Bruno hype by Sacha Baron Cohen, I noticed that there appears to be a rule regarding his entourage: all its members must differ from him in one consistent way and, in that same way, they must all be alike.  This translates, in these images, into his entourage always being (a) women or (b) men of color, but never both:

bruno_01

bruno_01a

bruno_02

bruno_03

bruno_04

bruno_21

Any thoughts? Is there some social psychologist out there with some speculation? Readers, what do you think?

P.S. – To the person who commented in the thread of our last Bruno-related post about never wanting to see his face again: I say, “Sorry.”

—————————

Lisa Wade is a professor of sociology at Occidental College. You can follow her on Twitter and Facebook.

Cole S.H. sent us this clip, via Salon, from Fox and Friends.  It features Brian Kilmeade, in a discussion about how marriage is positively related to mental health in Finland and Sweden, saying that the problem in America is that “…we keep marrying other species and other ethnics and other…”

So he’s against inter-ethnic and -racial marriage (and willing to say so on national television) and either he is inclined to believe that racial groups are actually different “species” or he is delusional in thinking that some states U.S. states allow us to marry (other) animals.

“That’s the rule,” people. Write it down.

—————————

Lisa Wade is a professor of sociology at Occidental College. You can follow her on Twitter and Facebook.

This ad for Ripolin paint reads:  “You walls deserve a paint wich [sic.] will age well.”

Not safe for work:

capture22

Two more posts–this one and this one–also reveal disdain for older women.

Found here.

—————————

Lisa Wade is a professor of sociology at Occidental College. You can follow her on Twitter and Facebook.