Archive: Jul 2010

Pew Research Center has released data suggesting an age gap in optimism for the future of American young adults.

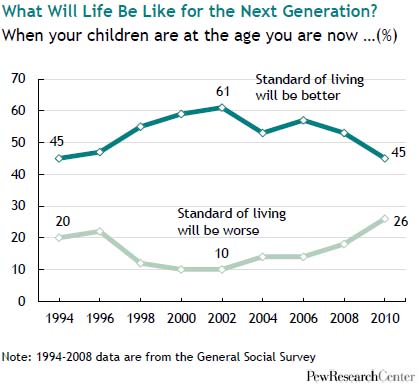
When asked if their children will be better off or worse off than they are, less than half of U.S. parents say “better off” and a full 25 percent say “worse off.”  This is the most pessimistic we’ve seen parents in 16 years.

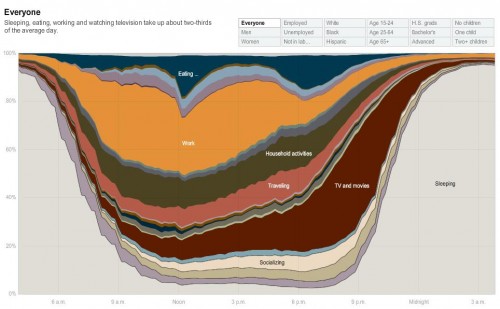
But their kids are more optimistic than anyone else, with 85% saying that they expect that their financial situation will improve next year:

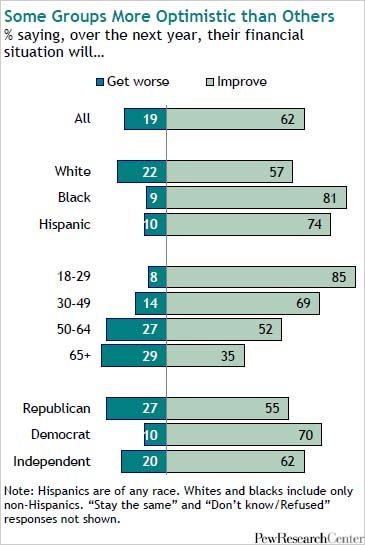
Of course these data aren’t entirely compatible, but it’s an interesting comparison nonetheless.  The idealism of youth?  The pessimism that comes with bad backs and mortgage payments?  The possibility that 18-29-year-olds have nowhere to go but up?

Economix, via Karl Bakeman.

Lisa Wade, PhD is an Associate Professor at Tulane University. She is the author of American Hookup, a book about college sexual culture; a textbook about gender; and a forthcoming introductory text: Terrible Magnificent Sociology. You can follow her on Twitter and Instagram.

Re-posted at Drawing On Indians.

Rob Walker (author of the fascinating book Buying In: What We Buy and Who We Are) sent me a link to a post at Drinkin’ and Dronin’ of a 1954 Levi Strauss brochure about “western Indian lore.” It’s a nice round-up of stereotypes and appropriations of Native Americans. We start off with an angry, bare-chested (and Levis-clad) man with a tomahawk, shield, moccasins, and headdress; I’d guess he’s supposed to be a warrior doing a war dance:

Then some descriptions of items associated with different tribes and the obligatory broken English (“just want ‘um”) familiar to anyone who watched The Lone Ranger and paid attention to Tonto:

I have no idea how accurate their descriptions of “unusual Indian weapons” are, but the overall tone of the brochure doesn’t inspire a lot of confidence.

And we have a lesson on “the Indian sign language,” the origins of which are “lost in the mists of time”:

Related posts: Potowatamis didn’t have a word for “global business center,” “discovering” Newfoundland, appropriation of Native Americans in fashion, teaching kids how to be American Indians, marketing the Vancouver Olympics, ice skaters dress up like Australian aborigines, native cultures in Avatar, Poca-Hotness, Indian costume for your dog, Indian Halloween costumes, Disney depicts Native Americans, “my skin is dark but my heart is white,” American Indians on t-shirts, sports mascots, Playmobil’s American Indian family, Howe Nissan’s American Indian statue, the “crying Indian” anti-litter PSA, Native Americans in Italian anti-immigration posters, and more American Indian dolls.

Also check out Adrienne K.’s blog Native Appropriations for lots of examples.

More proof of re-touching time from Photoshop Disasters, Lindsay Lohan’s cover and photo spread in German GQ featured a migrating belly button.

Where we might expect a belly button to be:


A surprisingly elevated belly button:

No belly button at all!

Gotta love our re-touching tag.

Lisa Wade, PhD is an Associate Professor at Tulane University. She is the author of American Hookup, a book about college sexual culture; a textbook about gender; and a forthcoming introductory text: Terrible Magnificent Sociology. You can follow her on Twitter and Instagram.

Two friends of mine recently had a baby and the hospital sent home all kinds of instructional packets, all of which included product sample, advertising materials, etc. One item they found was this advertisement for the U.S. Career Institute’s program to become a medical claims processor who works from home. The ad plays on the guilt mothers often still have about working outside the home:

I don’t have a problem, in and of itself, with suggesting that a job provides options for parents who want to be home full-time but also work. Given the fact that women still bear the primary responsibility for childcare even though most want or need to provide financial support to the family, I’m sure many women (and for that matter, a lot of men) would find them appealing (in theory, anyway; I have my doubts about a lot of the “work at home and make a gazillion dollars a week!” pitches, but I have no knowledge of this one in particular).

What bothers me is the way the ad is written to not just say, “Hey, if you are staying home with the kids but would like to work for pay as well, this is a great opportunity.” Instead, the blaring headline “I’m glad you work at home Mommy” ties into the idea that children desperately want their moms (but apparently not dads) to stay home with them, and moms who do so are being the best moms. Even among women who value their careers and always planned to return to the paid workforce, many are surprised by how much guilt they feel when they do so. They may feel guilty for leaving their child with another childcare provider, but if they actually look forward to going back to work and are excited or relieved to be there, they often feel guilty for that, too. This is a burden of guilt that new fathers do not generally share; while they may wish they could be home more with their children, they usually don’t express guilt for not doing so, largely because by working outside the home, they are actually fulfilling the normative role of what a good father does, whereas working outside the home, particularly when children are young, it incompatible with ideals of good mothering.

On the very bottom of pg. 2 it does say, “USCI is nationally accredited and approved for veterans’ education benefits!” That’s an interesting line, since the majority of people would would qualify for veterans’ educational benefits would be men (for instance, women currently make up only 15.5% of the U.S. Army). There are other elements on the brochure that seem gender-neutral — being your own boss, setting your own hours, increasing job opportunities in the field — but that line seems to be the one part that is more tailored to a male audience.

On an unrelated topic, I love the totally meaningless graph at the top right of the 2nd page: look! This one column is way bigger than the others! It is entirely lacking in any useful information — how are they defining “growth”? What is 0% referring to? What level of growth are we talking about here? For all we know, the health/medical services bar could indicated 0.000001% growth.

And just out of interest, do any of you have any experience with these types of jobs? Did it live up to the claims (particularly flexibility and the amount of money you can make)?

Chris Marshal and Captain Crab sent along this gem from The Second City Network:

Borrowed from Evolving Thoughts, via Pharyngula.

More on Disney: media consolidation and Tinkerbell, the real Johnny Appleseed, fallen princesses, modernizing the fairy tale, pickaninny slaves in Fantasia? yes, racist Disney characters, infantilizing adult women, gendered Disney t-shirts for kids, Deconstructing Disney princesses, are the new Disney princesses feminist?, race and gender in Princess and the Frog, socializing girls into marriage, and…

…did you know that the very first political tv commercial was made by Disney?  I like Ike!

Lisa Wade, PhD is an Associate Professor at Tulane University. She is the author of American Hookup, a book about college sexual culture; a textbook about gender; and a forthcoming introductory text: Terrible Magnificent Sociology. You can follow her on Twitter and Instagram.

In New Orleans sidewalk corners are adorned with delightful blue-and-white tiles, originally dating from the 1870s, telling you the name of the street you are crossing:

As I stepped over some of these, it occurred to met that they told a story about city planning.  Unlike the street signs in most cities (including New Orleans) that are attached to poles and displayed high, these can’t be seen by drivers.  These are designed for pedestrians, and perhaps bikers, using sidewalks.  They reflect a time when planners were designing the city for people on foot.

Lisa Wade, PhD is an Associate Professor at Tulane University. She is the author of American Hookup, a book about college sexual culture; a textbook about gender; and a forthcoming introductory text: Terrible Magnificent Sociology. You can follow her on Twitter and Instagram.

Way back in June my friend Abby Kinchy let me know about an article in the New York Times by Stephanie Coontz, a scholar best known for her book The Way We Never Were, which addresses myths about the “traditional” family. The article is about no-fault divorces and their pros and cons. What struck Abby were the accompanying images, which depict two hypothetical break-up letters (to “John” and “Jane”) that include a list of stereotypes about men and women, what they want out of marriage, and why they fight.

The Dear John letter:

So women want to break up because they feel stunted in their marriage (they miss out on experiences, they’re bored, they want to travel), they are still hung up on old flames, they want kids and their male partners (of course) don’t, and they just might be lesbians.

The Dear Jane letter:

What do men stereotypically want to leave their female partners for? Being emasculated (“you make me feel like less of a…”), men aren’t supposed to be monogamous (“it’s not natural for a man to be mono…”), they want more sex with more people, women spent too much money shopping, or their wives get stupid haircuts.

There is some gender agreement, though; neither men nor women can take a spouse who gets fat.

UPDATE: Citizenparables thinks the images are more playing on those still-existing stereotypes:

Perhaps the point of the images is rejecting – crossing out – those cliche stereotypical excuses, which are by implication false (because surely they can’t all be true!), leaving the essential idea that when someone leaves a relationship it’s a choice, pure and simple, which they ought to own rather than blame on either themselves or the partner.

The New York Times has a neat interactive graph based on data from the American Time Use Survey that lets you look at hour-by-hour time use broken down by sex, employment status, 3 racial/ethnic groups (White, Black, Hispanic), age, education, and number of children (though, unfortunately, you can’t search by more than one category at once). Here is the breakdown for the entire sample:

For people age 15-24:

Watching TV and movies takes up a lot of the time of those over age 65:

You can also click on a particular activity to get more information about it:

Those with advanced degrees spent the most time participating in sports or watching them in person; I suspect that the data might look a bit different if time spent watching sports on TV went in this category instead of the TV category:

Just a note, the averages for time spent at work seem pretty low, but that’s because they’re averaged over all days of the week, including any days off, rather than only days a person actually went to work.

Presumably the amount of time you’ll spend playing around with the site goes under computer use.