politics: the state

Here’s an interesting new wrinkle in the data on support for same sex marriage.  According to Gallup, 53% of Americans now favor such marriages, but we don’t necessarily think other people do.  Overall, Americans, on average, think that 63% of their fellow citizens oppose same sex marriage; in fact, 45% do.  That’s an over-estimate of 18 percentage points!

2

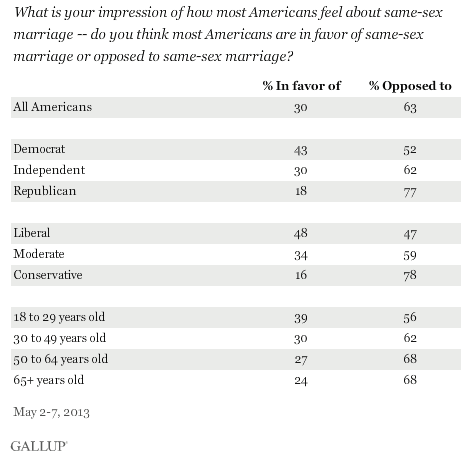
Interestingly, Americans of all stripes — Democrat and Republican, liberal and conservative, old and young — underestimate support for same sex marriage.  Liberals come the closest, thinking that 48% approve; conservatives are the farthest off, thinking that only 16% do.

This data resonates with the recent finding that both Democratic and Republican politicians underestimate their constituents’ progressiveness.  I suspect that these misconceptions may make politicians wary about pressing for progressive policies; I wonder how similar misconceptions among the voting public might shape the pace and trajectory of social change.

h/t @tylerkingkade. Cross-posted at Pacific Standard.

Lisa Wade, PhD is an Associate Professor at Tulane University. She is the author of American Hookup, a book about college sexual culture; a textbook about gender; and a forthcoming introductory text: Terrible Magnificent Sociology. You can follow her on Twitter and Instagram.

Hint from Dmitriy T.C.: he probably wears shorts to work.

Here’s the infographic, sent in also by sociologist Michael Kimmel, revealing the highest paid employee in each state.  Yellow, orange, and green states are all ones in which the most money goes to an athletic coach.  More details at DeadSpin.

1

Lisa Wade, PhD is an Associate Professor at Tulane University. She is the author of American Hookup, a book about college sexual culture; a textbook about gender; and a forthcoming introductory text: Terrible Magnificent Sociology. You can follow her on Twitter and Instagram.

Here at SocImages, we typically use the phrase “cultural appropriation” to describe rather frivolous borrowing of cultural practices and objects for the purposes of fun and fashion.  We’ve posted on examples ranging from the appropriation of American Indian fashion,  the mocking of the Harlem Shake, and an Orthodox Jew-inspired fashion show.

A slideshow of members of the punk scene in Burma, however, offers another version of cultural appropriation.  Their fashion is clearly inspired by the punk scenes of Britain and the U.S., which started in the 1970s. Accordingly to an interview with Ko Gyi at Vice and an article at Spiegel Online, some members of the sub-culture believe themselves to be rebelling against an oppressive state, others are interested in “non-political anarchism.”  While their music has to pass through state censors, they are talented in pushing their lyrics right up to the limit and deft in using metaphor to get their point across.

This is a fully different kind of appropriation, the kind that is about fighting the establishment, not spicing it up with “colorful” bits of marginalized groups.  It is more akin to feminists and gay liberation activists borrowing the tactics of the civil rights movement.  Alexander Dluzak writes:

In Burma, punk is far more than just a superficial copy of its Western counterpart. Here, what is probably the most rebellious of all subcultures in the Southeast Asian country is going up against one of the world’s most authoritarian regimes.

Cultures can borrow from one another, then, in ways that both empower and disempower.  It will be fascinating to see if this particular appropriation can shape the future of Burma.

Lisa Wade, PhD is an Associate Professor at Tulane University. She is the author of American Hookup, a book about college sexual culture; a textbook about gender; and a forthcoming introductory text: Terrible Magnificent Sociology. You can follow her on Twitter and Instagram.

Cross-posted at PolicyMic and The Huffington Post.

2We all-too-often take for granted that photographs like this one, revealing the impact of an oil pipeline leak on Mayflower, Arkansas, will be able to inform us about the state of the world. In fact, such images are taken by actual human photojournalists whose rights of access are protected by the First Amendment establishing the freedom of the press.

This is a real thorn in the side of both corporations and governments that might prefer to control media’s access to embarrassing or illegal activities.  So, often they try to strong arm journalists, co-opt local officials, or pass (likely illegal) legislation designed to protect them from the free press’ gaze.  Here are two current examples.

First, Mother Jones reports that Exxon officials are making efforts to limit reporter access to the oil pipeline leak in Mayflower, Arkansas.  This is happening in at least two ways.  First, Exxon representatives and local law enforcement are blocking journalists from accessing the spill site, threatening  “arrest for criminal trespass.”  Second, BoingBoing reports that the Federal Aviation Administration (FAA) has instituted a temporary “no-fly zone” in the area of the spill.  Here’s a screenshot from the FAA’s website:

1

Second, in the last two years Americans have shuddered in response to the release of undercover video revealing the abuse of animals on industrial farms and the torture of Tennessee Walking horses.  These have resulted in convictions, but they’ve also raised the hackles of the agricultural industry.  The New York Times reports that, in an effort to limit their risk, they’ve sponsored bills (proposed or enacted in about a dozen state legislatures) making it illegal to videotape animals on their property without their permission and requiring all prospective employees to reveal associations with animal rights groups.

These examples remind us how important it is that journalists have the freedom to do their job.  They also remind us that we must vigilantly protect that freedom.  Corporations, and governments too, have an incentive to limit the freedom of the press.  These are powerful entities, often in cahoots, that can and will ignore the First Amendment when they can get away with it.

Lisa Wade, PhD is an Associate Professor at Tulane University. She is the author of American Hookup, a book about college sexual culture; a textbook about gender; and a forthcoming introductory text: Terrible Magnificent Sociology. You can follow her on Twitter and Instagram.

While some austerity advocates really fear (although incorrectly) the consequences of deficit spending, the strongest proponents are actually only concerned with slashing government programs or the use of public employees to provide them.  In other words their aim is to weaken public programs and/or convert them into opportunities for private profit. One measure of their success has been the steady decline in public employment.  Floyd Norris, writing in the New York Times notes:

For jobs, the past four years have been a wash.

The December jobs figures out today indicate that there were 725,000 more jobs in the private sector than at the end of 2008 — and 697,000 fewer government jobs. That works into a private-sector gain of 0.6 percent, and a government sector decline of 3.1 percent.

In total, the number of people with jobs is up by 28,000, or 0.02 percent.

How does that compare? It is by far the largest four-year decline in government employment since the 1944-48 term. That decline was caused by the end of World War II; this one was caused largely by budget limitations.

The chart below, taken from the same post, also reveals just how weak private sector job creation has been over the past 12 years (compare the top three rows — the presidencies of Obama and Bush — w job changes This graphic from the New York Times highlights just how significant the decline in public employment has been in this business cycle compared with past ones.  Each line shows the percentage change in public sector employment for specified months after the start of a recession.  Our recent recession began December 2007 and ended June 2009.   As you can see, what is happening now is far from usual.

1

It is also worth noting that despite claims that most Americans want to see cuts in major federal government programs, the survey data show the opposite.  For example, see the following graphic from Catherine Rampell’s blog post. economix-22pewwhattocut-blog480 As Rampell explains:

In every category except for “aid to world’s needy,” more than half of the respondents wanted either to keep spending levels the same or to increase them. In the “aid to world’s needy” category, less than half wanted to cut spending.

Not surprisingly, this assault on government spending and employment will have real consequences for the economy and job creation. All of this takes us back to the starting point — we are talking policy here.  Whose interests are served by these trends?

Martin Hart-Landsberg is a professor of economics at Lewis and Clark College. You can follow him at Reports from the Economic Front.

Cross-posted at Reports from the Economic Front.

While newspapers give a lot of ink to arguments about whether reducing the budget deficit will boost or reduce growth, they seem to have little interest in the related issue of whether economic growth really benefits the great majority.

David Cay Johnston, the Pulitzer Prize winning financial journalist, recently addressed this issue drawing on the work of economists Emmanuel Saez and Thomas Piketty:

In 2011 entry into the top 10 percent… required an adjusted gross income of at least $110,651. The top 1 percent started at $366,623.

The top 1 percent enjoyed 81 percent of all the increased income since 2009. Just over half of the gains went to the top one-tenth of 1 percent, and 39 percent of the gains went to the top 1 percent of the top 1 percent.

Ponder that last fact for a moment — the top 1 percent of the top 1 percent, those making at least $7.97 million in 2011, enjoyed 39 percent of all the income gains in America.

So, 81 percent of all the new income generated from 2009 to 2011 was captured by the top 1 percent income earners, where income is defined as adjusted gross income, which refers to income minus deductions or taxable income.  In other words, growth, even accelerated growth, is not going to do the majority much good if the economic structure remains the same.

Johnston highlights the problem with our existing economic model with perhaps an even more shocking example.  He compares the average income growth of the bottom 90 percent with the average income growth of the top 10 percent, 1 percent, and top 1 percent of the top 1 percent over the period 1966 to 2011.

It turns out that the average income of the bottom 90 percent rose by a miniscule $59 over the period (as measured in 2011 dollars).  By comparison, the average income of the top 10 percent rose by $116,071, the average income of the top 1 percent rose by $628,817, and the average income of the top 1 percent of the top 1 percent increased by a whopping $18,362,740.  In short, growth alone means little if the great majority of people are structurally excluded from the benefits.

In an effort to highlight this extreme disparity in adjusted income growth rates, Johnston suggests plotting the numbers on a chart, with $59, the amount gained by the bottom 90 percent, represented by a bar one inch high.  As the chart below shows, the bar representing average gains for the top 10 percent would be 163 feet high, that for the top 1 percent would be 884 feet high, and that for the top 1 percent of the top 1 percent would be 4.9 miles high.

1

In sum, the real challenge facing the great majority of Americans is not figuring out how to make the economy growth faster.  Rather, it is figuring out how to create space for a real debate about how to transform our economy so that growth will actually satisfy majority needs.

Martin Hart-Landsberg is a professor of economics at Lewis and Clark College. You can follow him at Reports from the Economic Front.

The current political discourse is so focused on a single form of government revenue, that the word taxes has become essentially synonymous with just one tax in particular; the federal income tax.  In fact, unless there is a foreign policy crisis, the federal income tax usually dominates most political discussion given how the federal budget (or increasingly the federal debt) relates to almost anything and everything the federal government does (or does not do in more and more instances).

For example, during the closing months of 2012 we watched how a fight over a sunset of the Bush Tax Cuts almost shoved the United States over a fiscal cliff.  Just prior to this near crisis, the most discussed difference between 2012 presidential candidates was their disagreement about a 4 point increase in the highest federal income bracket.  Also, Mitt Romney will likely be remembered mostly for his disparagement and disregard of “The 47% of United States Citizens who pay no federal income tax.”

However, limiting discussion about government funding and spending to just the federal income tax and ignoring the other types of payments we make to the treasury is not without consequence, especially given how the federal income tax is actually a very unique kind of tax.  Unlike excise taxes, payroll deductions, sales taxes and most property taxes that are regressive or require the poor to pay a larger proportion of their resources than the wealthy; the federal income tax is one of the few progressive taxes in the United States because at least on paper (I say that because these marginal rates often do not equate the larger effective rates given that the wealthy are afforded more loopholes, deductions, and lower rates on investment income), the rich pay larger marginal rates than the middle-class and poor.   Thus, with our political discussion largely limited to the federal income tax, it should come as no surprise conservatives are so easily able to frame “The State,” especially the federal government, as a perverse Robin Hood who steals from the rich (the makers as they are being called now) to give to the poor (the takers).

The non-profit, non-partisan Institution on Taxation and Economic Policy recently released its research on the taxes families in the United States paid in 2010.  These findings reveal when the focus is taken off the federal income tax and the entire tax system is examined, cumulative household taxes in nearly every state are regressive because the less money a family makes, the larger proportion they pay to the different levels of government.  As the graph below shows, the cumulative tax system is regressive because sales, excise and property taxes offset progressive income taxes at both the state, and federal levels.

The tax system as a whole is largely regressive because the higher one’s class standing, the lower the proportion of total taxes they pay.  While the report provides great details in the variations across each state, the graph below shows that on average, the lowest 20% of earners pays an overall tax rate that is more than twice of what the top 1% of earners pay.

While many citizens perceive the U.S. tax code as inherently unfair because the wealthy have higher marginal rates on their federal income tax (the only one anyone ever seems to talk about); an examination of the entire system reveals the opposite as cumulatively, the poor pay a larger proportion of their income to local, state, and the federal governments.

—————————

Jason Eastman is an Assistant Professor of Sociology at Coastal Carolina University who researches how culture and identity influence social inequalities.

Cross-posted at Reports from the Economic Front.

The British economy is a disaster.  Oddly enough most analysts find it difficult to explain why.

Actually the reason is quite simple. The British government responded to its own Great Recession by cutting spending and raising taxes.  The result, which is anything but mysterious, is that the county remains in deep recession.

Matthew O’Brien, writing in The Atlantic, describes the situation as follows:

…public net investment — things like roads and bridges and schools,  and everything else the economy needs to grow — has fallen by half the past three years, and is set to fall even further the next two. It’s the economic equivalent of shooting yourself in both feet, just in case shooting yourself in one doesn’t completely cripple you. Austerity has driven down Britain’s borrowing costs even further, but that’s been due to investors losing faith in its recovery, rather than having more faith in its public finances. Indeed, weak growth has kept deficits from coming down all that much, despite the higher taxes and slower spending. In other words, it’s economic pain for no fiscal gain.

Below is a chart taken from The Atlantic article.  It shows that:

Britain’s stagnating economy has left it in worse shape at this point of its recovery than it was during the Great Depression. GDP is still more than 3 percent below its 2008 peak, and it hasn’t done anything to catchup in years. At this pace, there will be no recovery in our time, or any other time.

 gdp to december 2012

In other words, while the British economy suffered a deeper decline during the Great Depression period of 1930 to 1934 than to this point in the Great Recession which started in 2008, the economy recovered far more quickly then than now.  In fact, it doesn’t seem to be recovering now at all.

Perhaps the most surprising thing about the situation is that political leaders appear determined to stay the course.

Martin Hart-Landsberg is a professor of economics at Lewis and Clark College. You can follow him at Reports from the Economic Front.