methods/use of data

Cross-posted at Family Inequality.

It is great to acknowledge and celebrate the increase in father involvement in parenting. But it is not helpful to exaggerate the trend and link it to the myth-making about looming female dominance. Yesterday’s feature in the Sunday New York Times does just that, and reminds me that I meant to offer a quick debunking of Hanna Rosin’s TED talk.

The story is headlined “Just Wait Till Your Mother Gets Home.” The picture shows a group of dads with their kids, as if representing what one calls “the new normal.” Careful inspection of the caption reveals it is a “daddy and me” music class, so we should not be surprised to see a lot of dads with their kids.

The article also makes use of a New Yorker cover, which captures a certain gestalt — it’s a funny exaggeration — but should not be confused with an empirical description of the gender distribution of parents and playgrounds:

Naturally, the story is in the Style section, so close reading of the empirical support is perhaps a fool’s errand. However, I could not help noticing that the only two statistics in the story were either misleading or simply inaccurate. In the category of misleading, was this:

In the last decade, though, the number of men who have left the work force entirely to raise children has more than doubled, to 176,000, according to recent United States census data. Expanding that to include men who maintain freelance or part-time jobs but serve as the primary caretaker of children under 15 while their wife works, the number is around 626,000, according to calculations the census bureau compiled for this article.

The Census Bureau has for years employed a very rigid definition of stay-at-home dads, which only counts those who are out of the labor force for an entire year for reasons of “taking care of home and family.” This may seem an overly strict definition and an undercount, but if you simply counted any man with no job but with children as a stay-at-home dad, you risk counting any father who lost a job as stay-at-home. (A former student of mine, Beth Latshaw, now at Appalachian State University, has explored this issue and published her results here in the journal Fathering.)

In any event, those look like big numbers, but one should always be wary of raw numbers in the news. In fact, when you look at the trend as published by the Census Bureau, you see that the proportion of married couple families in which the father meets the stay-at-home criteria has doubled: from 0.4% in 2000 to 0.8% today. The larger estimate which includes fathers working part-time comes out to 2.8% of married couple families with children under 15. The father who used the phrase “the new normal” in the story was presumably not speaking statistically.

(Source: My calculations from Census Bureau numbers [.xls file]. Includes only married-couple families with children under age 15.)


That’s the misleading number. The inaccurate number is here:

About 40 percent of women now make more than their husbands, the bureau’s statistics show, and that may be only the beginning of a seismic power shift, if new books like “The Richer Sex: How the New Majority of Female Breadwinners Is Transforming Sex, Love, And Family,” by Liza Mundy, and “The End of Men: And the Rise of Women,” by Hanna Rosin, are to be believed.

I guess in these troubled times for the newspaper business it might be acceptable to report X and Y statistic “if so-and-so is to be believed.” But it is a shame to do so when the public is paying the salary of people who have already debunked the numbers in question. Just the other day, I wrote about that very statistic: “Really? No. I don’t know why this keeps going around.” Using freely available tables (see the post), I calculated that a reasonable estimate of the higher-earning-wife share is 21%. In fact, on this point Liza Mundy and Hanna Rosin and are not to be believed.

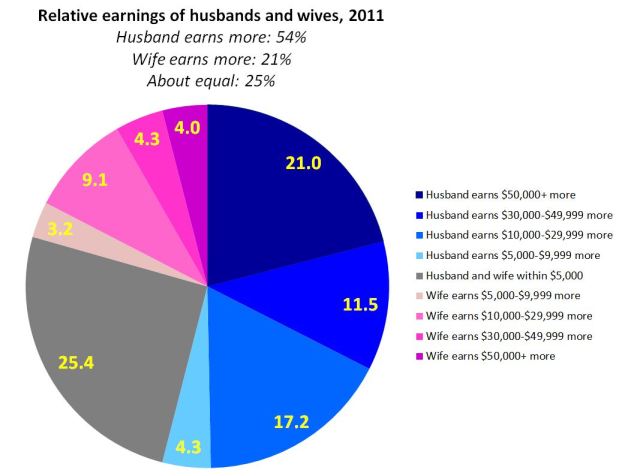
(Source: My graph from Census Bureau numbers.)


TED: Misinformation Frequently Spread

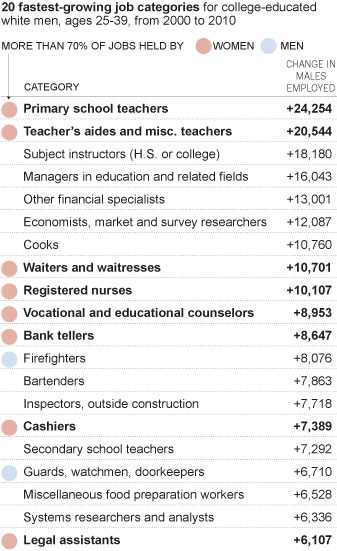
There is a TED talk featuring Hanna Rosin from the end of 2010, and I finally got around to watching it. Without doing a formal calculation, I would say that “most” of the statistics she uses in this talk are either wrong or misinterpreted to exaggerate the looming approach of female dominance. For example, she says that the majority of “managers” are now women, but the image on the slide which flashes by briefly refers to “managers and professionals.” Professionals includes nurses and elementary school teachers. Among managers themselves, women do represent a growing share (although not a majority, and the growth has slowed considerably), but they remain heavily segregated as I have shown here.

Rosin further reports that “young women” are earning more than “young men.” This statistic, which has been going around for a few years now, in fact refers to single, child-free women under age 30 and living in metropolitan areas. That is an interesting statistic, but used in this way is simply a distortion. (See this post for a more thorough discussion, with links.)

Rosin also claims that “70% of fertility clinic patients” prefer to have a female birth. In her own article in the Atlantic, Rosin reports a similar number for one (expensive, rare) method of sex selection only (with no source offered) — but of course the vast majority of fertility clinic patients are not using sex selection techniques. In fact, in her own article she writes, “Polling data on American sex preference is sparse, and does not show a clear preference for girls.”

Finally, I don’t think I need to offer statistics to address such claims as women are “taking control of everything”and “starting to dominate” among “doctors, lawyers, bankers, accountants.” These are just made up. Congress is 17% female.

Philip N. Cohen is a professor of sociology at the University of Maryland, College Park, and writes the blog Family Inequality. You can follow him on Twitter or Facebook.

At the journal Epidemiology, John Cunningham published a proof-of-concept article aimed to show that Twitter is a useful and viable method of data collection.

His data captured the incidences of the words “wine,” “beer,” and “vodka” over the course of a week.  The figure shows that people are tweeting about these spirits more-or-less in unison, that they tend to do so increasingly towards the end of each day, and that wine and beer are weekday favorites, but vodka comes out ahead on the weekends, especially as the night wears on:

So, I thought that was kinda neat!  Now we know something about when and what people are (tweeting about) drinking and also that Twitter is good for something other than sending people messages that everyone else can see, but no one else can understand.

*Via Neuroskeptic, from whom I borrowed this great title.

Lisa Wade, PhD is an Associate Professor at Tulane University. She is the author of American Hookup, a book about college sexual culture; a textbook about gender; and a forthcoming introductory text: Terrible Magnificent Sociology. You can follow her on Twitter and Instagram.

For those readers who teach statistics, or methods, or cover the representation of data in their classes, or, like me, are just geeky and unfortunately easily amused, I present to you The World’s Most Accurate Pie Chart.

Gwen Sharp is an associate professor of sociology at Nevada State College. You can follow her on Twitter at @gwensharpnv.

Cross-posted at Family Inequality.

Lots of buzz over a New York Times article about men moving into female-dominated occupations, which reported that “more and more men are starting to see the many benefits of jobs long-dominated by women.”

The Times produced this table, which shows the fastest growing occupations for (for some reason) college-educated White men, ages 25-39:

The ones with the pink dots are 70% female or more. The increase of young college educated White men in these occupations over 10 years appears striking, but the numbers are small. For example, compare that increase of (round numbers) 10,000 young White male registered nurses to the 1,900,000 full-time year-round nurses there were in 2010.

Moreover, consider that increase of 10,000 nurses in light of the overall growth of registered nurses from 2000 to 2010: about 500,000. Overall, the representation of men among full-time year-round registered nurses increased from 9.4% to 10.3% during the decade.

The Times article attempts to describe a broad trend of men moving into “pink-collar” jobs:

The trend began well before the crash, and appears to be driven by a variety of factors, including financial concerns, quality-of-life issues and a gradual erosion of gender stereotypes. An analysis of census data by The New York Times shows that from 2000 to 2010, occupations that are more than 70 percent female accounted for almost a third of all job growth for men, double the share of the previous decade.

Bold claims. But check the next sentence: “That does not mean that men are displacing women — those same occupations accounted for almost two-thirds of women’s job growth.” So, lots more men are in these jobs, but even more women are? How does that reflect an “erosion of gender stereotypes”? It seems like it reflects an increase in the size of female-dominated occupations.

In fact, as I reported briefly before, occupational gender segregation dropped barely a hair in the 2000s, from 51 to 50 on a scale of 0 to 100, compared with drops of 5 or 6 points in the decades before 1990. That is a lost decade for integration.

And if you look specifically at the category the Times chose — occupations that are 70% female or more — the percentage of men in those occupations increased, but only from 5.0% to 6.1%. And nurses? In 2010, 0.4% of all full-time year-round working men were nurses, up from 0.3% in 2000. Women are still 11-times more likely to be nurses than men.

Now that’s what you call a “gradual erosion of gender stereotypes.”

Sources: U.S. Census tables for 2000 and 2010 (table B24121).

How does a scientist measure your unconscious mind?  It turns out, it can be done.  With a technique called the Implicit Association Test, psychologists can measure your unconscious beliefs about anything: whether, deep down, you associate Black men with weapons, Asians with foreigners, fat people with laziness, men with science, and more.  You can test yourself on all manner of implicit beliefs here.

It works by putting a pair of words on each side of a computer screen. Sometimes the pair matches your unconscious mind; like (for most of us, unfortunately) young and good.  Sometimes the pair challenges your unconscious mind; like (for most of us, unfortunately) old and good.  You’re asked to do a timed test focusing on just one of the pair; we’re all quicker when the terms match than when they don’t.  For more, read up about it here.

In any case, it turns out the phenomenon has a name — the Stroop effect — and the best illustration of it I’ve ever seen was featured on BoingBoing.  It involves colors and color names. For a lifetime, we’ve been taught to associate certain colors with certain names. Accordingly, our brain fires faster and more confidently when we see the name in the color, compared to when we see the name in an opposing color.  See for yourself: can you read both lists of colors equally comfortably, un-self-consciously, and quickly?Probably not.  So, for better or worse, scientists see this same effect when they try to get our brains to process paired words like Asian/American and men/science.  The results of these experiments are depressing (both abstractly and often personally when we take the tests ourselves), but it’s pretty amazing that we’re able to delve that deeply into the mind with such a simple task.

Lisa Wade, PhD is an Associate Professor at Tulane University. She is the author of American Hookup, a book about college sexual culture; a textbook about gender; and a forthcoming introductory text: Terrible Magnificent Sociology. You can follow her on Twitter and Instagram.

Dmitriy T.M. sent in a TED talk in which Ben Goldacre discusses the problems with many of the scientific findings we hear about in the media, highlighting the importance of scientific literacy and critical consumption of science reporting:

And while we’re on the topic of potentially misleading statistics, Dolores R. and Sarah E. sent in an image posted at boing boing as one of “the best set of infographics ever,” helpfully illustrating the difference between correlation and causation:

Cross-posted at Montclair SocioBlog.

Ethnographers worry that their mere presence on the scene may be influencing what people do and thus compromising the truth of their studies.  They try to minimize that impact, and most of their reports give detailed descriptions of their methods so that readers can assess whether the data might be corrupted.

Photojournalists also claim to be showing us the truth — “pictures don’t lie” — but they compunctions about influencing the people in their photos.  Here for example is a photo taken in Israel by Italian photographer Ruben Salvadori.  (This is a screen grab of a video, hence the subtitles.)

The defiant Palestinian youth, the flames of the roadblock — it’s all very dramatic.  But it is far from spontaneous.  Here’s the photo from another point of view:

Salvadori studied anthropology, and he is well aware that observers influence what they observe.  But editors want “good” photos, not good ethnography.  So observer influence is an asset, not a problem.

If you point a tiny camera at somebody, what is he going to do?  Most likely, he’s going to smile or do something.  Now imagine this enlarged with a group of photographers. That show up with helmets, gas masks, and at least two large cameras each, and they come there to take photos of what you do.  So you’re not going to sit there twiddling your thumbs.

No, the youths don’t twiddle their thumbs, not with the photogs on the scene.  Instead, they burn a flag.

Their relationship is symbiotic.  The photogs want dramatic images, the insurgent youths want publicity.  Of course, even with the Palestinians youths and the Israeli soldiers, when the action gets real, nobody is thinking about how they’ll look in a photo.

—————————

(The full 8-minute video of Salvadori talking about photography in the combat zone was posted at PetaPixel back in October, though I didn’t hear about it until recently.)

Cross-posted at Family Inequality.

There’s an interesting example of how to interpret scientific results — and draw policy implications from them — from the world of birth practices and safety.

The subject of the debate is a major new study from the British Medical Journal. The study followed more than 60,000 women in England with uncomplicated pregnancies, excluding those who had planned caesarean sections and caesarean sections before the start of labor. They compared the number of bad outcomes — from death to broken clavicles – for women depending on where they had their births.

One comparison stands out in the results. From the abstract: “For nulliparous women [those having their first birth], the odds of the primary outcome [that is, any of the negative events] were higher for planned home births” than among those planned for delivery in obstetric units. That is, the home births had higher rates of negative events. The difference is large. Here’s a figure to illustrate:

The error bars show 95% confidence intervals, so you can see the difference between home births and obstetric-unit births is statistically significant at that level. These are the raw comparisons, but the home-versus-obstetric comparison was unchanged when the analysts controlled for age, ethnicity, understanding of English, marital or partner status, body mass index, “deprivation score,” previous pregnancies, and weeks of gestation. Further, by restricting the comparison to uncomplicated pregnancies and excluded all but last-minute c-sections, it seems to be a very strong result.

But what to make of it?

In their conclusion, the authors write:

Our results support a policy of offering healthy nulliparous and multiparous women with low risk pregnancies a choice of birth setting. Adverse perinatal outcomes are uncommon in all settings, while interventions during labour and birth are much less common for births planned in non-obstetric unit settings. For nulliparous women, there is some evidence that planning birth at home is associated with a higher risk of an adverse perinatal outcome.

But in what way do the results “support a policy”? The “higher risks” they found for planned home births are still “uncommon,” by comparison, with those in poor countries, for example. But the home birth risk is 2.7-times greater.

The Skeptical OB, who is a reliable proponent of modern medical births, titled her post, “It’s official: homebirth increases the risk of death.” She added some tables from the supplemental material, showing the type of negative events and conditions that occurred. Her conclusion:

“In other words, any way you choose to look at it, no matter how carefully you slice and dice the data, there is simply no getting around the fact that homebirth increases the risk of perinatal death and brain damage.”

I guess the policy options might include include whether home births should be encouraged, more regulated, covered by public and/or private health insurance, banned, penalized or (further) stigmatized.

Home birth seems safer than letting children ride around unrestrained in the back of pickup trucks, which is legal in North Carolina – as long as they’re engaged in agricultural labor. On the other hand, we have helmet laws for kids on bicycles in many places. And if a child is injured in either situation, hopefully an ambulance would take them to the hospital even if the accident were preventable.

In other words, I don’t think policy questions can be resolved by a comparison of risks, however rigorous.