
Cross-posted on Reports from the Economic Front.
The Occupy Movement has clearly transformed conversations about the economy. It is now inequality — in particular, the gap between the top 1% and everyone else — rather than the national debt that dominates the news.
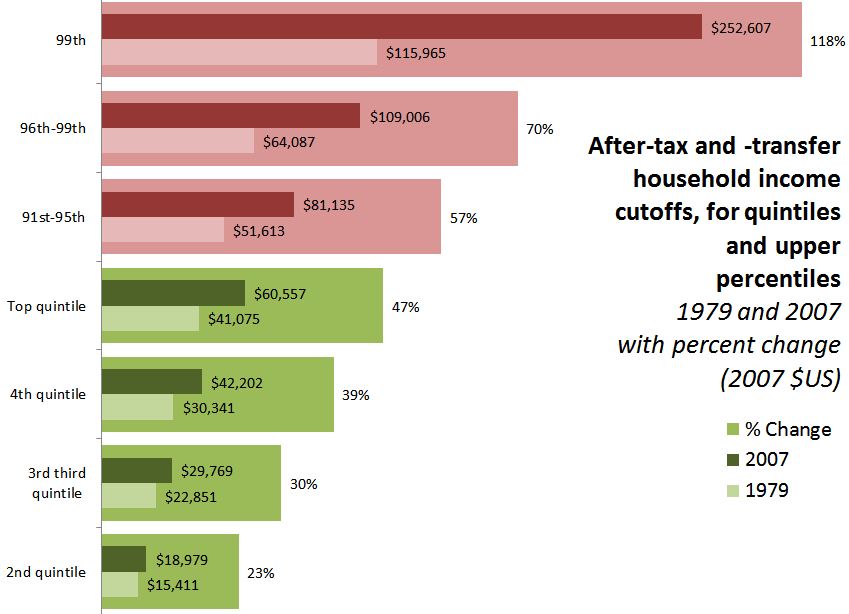
To review, this gap is real, as the following charts from the Economic Policy Institute make clear. This chart shows the percentage increase in household income over the period 1979 to 2007 by income group. While the top 1% enjoyed income gains of 224% over the period, the gains enjoyed by the bottom 90% were far more modest: 5%. Equally striking is the fact that the household income of top 0.01% shot up an astounding 390%.

Unfortunately, there is another income gap that has not received nearly as much attention. It is the white-nonwhite gap. The Portland, Oregon based Coalition of Communities of Color recently published a report on the socioeconomic situation of people of color in Multnomah Country (which includes Portland).
As the chart below reveals, the mean income of families of color in the top decile (10%) actually declined by $6,002 over the years 1979 to 2007. By contrast, the mean income of white families in the top 10% rose by $122,591. White families and families of color in the bottom half of the distribution all suffered losses.

The following two charts show the mean earnings of each group by decile and their change between 1979 and 2007.
Portrait in 1979:


This last chart shows poverty rates by color. Clearly, as we work to create a more equitable society, our efforts must also be guided by awareness of the existence of serious racial and ethnic inequities.


