economics

In 1956 sociologist C. Wright Mills published a book titled The Power Elite.  In it, he argued that our democracy was corrupt because the same people exercised power in business, the military, and politics.  This small group, with so many important roles and connections, had an influence on our society that was far out-of-proportion with their numbers.  This, he concluded, was a dire situation.

Fast forward to 2012 and Lambert Strether posted a series of Venn diagrams at Naked Capitalism.  Strether writes:

[This] nifty visualization… shows how many, many people, through the operations of Washington’s revolving door, have held high-level positions both in the Federal government and in major corporations. To take but one example, the set of all Treasury Secretaries includes Hank Paulson and Bob Rubin, which overlaps with the set of all Goldman Sachs COOs. The overlapping is pervasive. Political scientists and the rest of us have names for such cozy arrangements — oligarchy, corporatism, fascism, “crony capitalism” — but one name that doesn’t apply is democracy.

UPDATE: I’ve included a criticism of the methodology after the diagrams; the overlap portrayed here is almost exclusively among Democratic politicians and the diagrams were explicitly intended to point out connections among progressives.

See for yourself:

On the methods for putting together these diagrams, Strether writes about the person who’s behind the diagrams:

Herman’s honest: Her goal is to “expose progressive corporatism,” and — assuming for the sake of the argument that D[emocrat]s are progressive, and that “progressives” are progressive — her chart does exactly that, and very effectively, too.

But what her data does not do is expose corporatism as such; there are very, very few Rs listed; it strains credulity that Hank Paulson was the only high-level GS operative in the Bush administration, for example, and if GS isn’t the R[epublican]s’ favorite bank, there’s surely another.

Hence, Herman’s chart, if divorced from context[2], might lead somebody — say, a child of six — to conclude that the only corporatists in Washington DC are D[emocrat]s.

Thanks to Carolyn Taylor for pointing out the methods bias.

Lisa Wade, PhD is an Associate Professor at Tulane University. She is the author of American Hookup, a book about college sexual culture; a textbook about gender; and a forthcoming introductory text: Terrible Magnificent Sociology. You can follow her on Twitter and Instagram.

Cross-posted at Montclair SocioBlog.

The New York Times ran these graphics showing the word frequencies of the Republican and Democratic conventions.  I’ve added underlining on the keywords that seem to differentiate the two conventions. (The data on the Democrats runs only through Sept. 4, but it looks like the themes announced early on will be the ones that are repeated.)

Both parties talked about leadership, the economy, jobs, and families.  More interesting are the differences.  Democrats talked a lot about Women, a word which seems to be absent from the Republican vocabulary.  The Democrats also talked about Health and Education.  I find it curious that Education does not appear in the Republican word cloud.

The Republican dictionary falls open to the page with Business – ten times as many mentions as in the Democrats’ concordance.  If you go to the interactive Times graphic, you can click on Business and see examples of the contexts for the word.  Many of these excerpts also contain the word Success.

You can put the large-bubble words in each graphic in a sentence that condenses the party’s message about government, though that word – Government – does not appear in either graphic.   For the Republicans, government should lower Taxes so that Business can Succeed, creating Jobs.

For the Democrats, government should protect the rights of Women and ensure that everyone has access to Health and Education.

Perhaps the most telling most interesting word in the Democratic cloud is Together.  The Republican story is one of individual success in business, summed up in their repeated phrase, “I built that.”  The Democrats apparently are emphasizing what people can accomplish together.  These different visions are not new.  They go back at least to the nineteenth century.  (Six years ago, I blogged here about these visions as NFL brands — Cowboys and Steelers — and their parallels in US politics.)

(HT: Neal Caren who has posted his own data about the different balance of emotional expression at the two conventions.)

The recession is over in the U.S.. We’re now in the recovery period.

This would be more comforting if the pace of the recovery weren’t glacial. If you pay attention to weekly unemployment numbers or monthly economic reports, you’ve gotten used to the word “disappointing.” Yes, the economy is gaining jobs, but slowly. At this rate, it would take years to climb out of the hole the recession left us in.

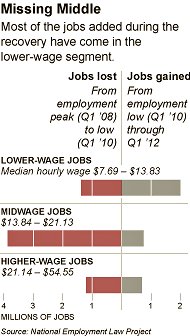
But the slow pace of growth isn’t the only concern. The New York Times discusses the types of new jobs being created. While the majority of the jobs lost were midwage jobs, so far most of the new jobs are low-wage:

We’re not gaining new jobs very quickly. And when we do, it’s hard to find a job that provides a solidly middle-class income among those that are being added, continuing the trend of job polarization that economists have shown is reinforced during economic downturns.

Cross-posted at Reports from the Economic Front.

It’s election season and Republicans and Democrats are working hard to demonstrate that they support dramatically different policies for rejuvenating the economy.

While the Democratic Party’s call for more government spending makes far more sense than the Republican Party’s call for cuts in government spending (see below), the resulting back and forth hides the far more serious reality that our existing economic system no longer appears capable of supporting meaningful social progress for the great majority of Americans.

The chart below helps to highlight our economy’s worsening stagnation tendencies.  Each point shows the 10 year annual average rate of growth and the chart reveals a decade long growth trend that is moving sharply downward.

As David Leonhardt explains:

The economy’s recent struggles arguably began in late 2001, when a relatively mild recession ended and a new expansion began. The problem with this new recovery was that it wasn’t especially strong. From the fourth quarter of 2001 through the fourth quarter of 2007 (when the financial crisis began), the economy grew at an average annual rate of only 2.7 percent. By comparison, the average annual growth rate of both the 1990s and 1980s expansions exceeded 3.5 percent.

This mediocre expansion was followed by the severe recession and weak recovery brought on by the financial crisis. The combined result is that, in recent years, the economy has posted its slowest 10-year average growth rates since the Commerce Department began keeping statistics in 1947.

In fact, the economic growth figures for the period 1995 to 2007 were artificially propped up by a series of bubbles, first stock and then housing.  Once those bubbles popped, average growth rates began steadily falling.

The weakness (and unbalanced nature) of our current weak recovery is well captured in the following chart from Catherine Rampell, which compares the percent change in various indicators in the current recovery (which began in June 2009) with previous post-war recoveries.  The first point to stress is that the current recovery lags the average in all indicators but one: corporate profits.  The second is that government spending has actually been falling during the current recovery, no doubt one reason that the percent increase in so many indictors remains below the average in previous recoveries; the public sector is actually smaller today than it was three years ago.

The relative strength in the performance of corporate profits helps to explain why the two established political parties feel no real pressure to focus on our long term economic problems; corporations just don’t find the current situation problematic despite the economy’s weak overall economic performance.

Even more telling of the growing class divide is the explosion in income inequality over the last thirty years, which is illustrated in the following chart.

In other words, while corporations have succeeded in raising profits at the expense of wages, those in the top income brackets have been even more successful in raising their income at the expense of almost everyone else.  Notice, for example, that median household income in 2010 is roughly where it was in the late 1980s while the median income of the top households racked up impressive gains. Thus, the very wealthy have every reason to do what they are currently doing, which is using their wealth to ensure that candidates restrict their economic proposals to reforms that will do little to change the existing system.

The takeaway: without a mass movement demanding change, election debates are unlikely to seriously address our steady national economic decline.

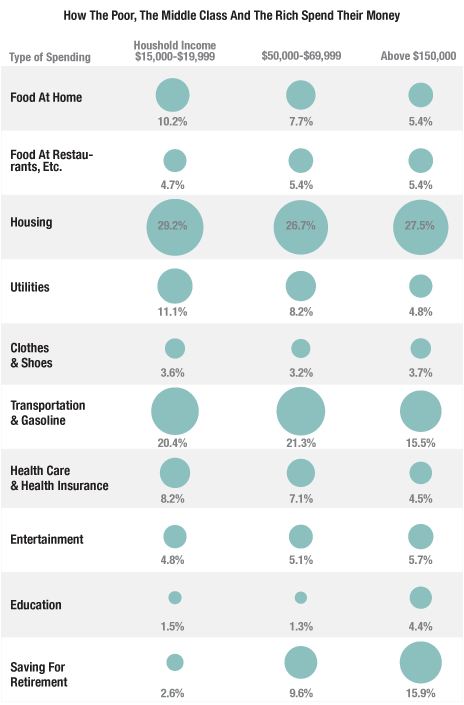
NPR’s Planet Money blog posted an interesting image of differences in how we allocate income based on how much we make. The image looks at three income groups and shows what percent of their  household income budget they spend various categories, using Bureau of Labor Statistics Consumer Expenditure Survey data:

As we see, the largest expense for every group is housing; for the low-income group, 40% of their income goes just to paying for a place to live. They also use more of their income to cover basic necessities — utilities, food eaten at home, transportation.The high-income group, on the other hand,  spends quite a bit more on education.

Look at that last row: saving for retirement (which includes Social Security contributions). This is a particularly striking difference. The affluent are able to put away a significant portion of their income for retirement; for those living just above the poverty line, it’s much, much less than the amount financial planners would recommend (even the middle-income group is saving about the minimum amount generally recommended to prepare for retirement). When so much of your income goes to simply meeting day-to-day needs, saving for the future is a luxury many just cannot afford.

UPDATE: NPR has updated their post, saying the image they had up initially incorrectly. They posted a new image, with notably lower spending on housing:

Eagle-eyed reader David C. pointed this out to me. The revised numbers seem surprisingly low to both of us.Looking at the NPR post again, I think I misunderstood what they were representing; I think this isn’t the percent of total income, but rather % of the household budget, which may not be identical. That said, I looked at some Consumer Expenditure Survey data (here and here) and can’t get the numbers to work out to what they’re showing in the updated image. If someone can, please send us a note at socimages(at)thesocietypages.org and we’ll do another update. Thanks!

Cross-posted at Reports from the Economic Front.

The Pew Research Center recently published a report titled “Pervasive Gloom About the World Economy.” The following two charts come from Chapter 4 which is called “The Causalities: Faith in Hard Work and Capitalism.”

The first suggests that the belief that hard work pays off remains strong in only a few countries: Pakistan (81%), the U.S. (77%), Tunisia (73%), Brazil (69%), India (67%) and Mexico (65%). The low scores in China, Germany, and Japan are worth noting. This is not to say that people everywhere are not working hard, just that many no longer believe there is a strong connection between their effort and outcome.

The second chart highlights the fact that growing numbers of people are losing faith in free market capitalism.  Despite mainstream claims that “there is no alternative,” a high percentage of people in many countries do not believe that the free market system makes people better off.

GlobeScan polled more than 12,000 adults across 23 countries about their attitudes towards economic inequality and, as the chart below reveals, the results were remarkably similar to those highlighted above.  In fact, as GlobeScan noted, “In 12 countries over 50% of people said they did not believe that the rich deserved their wealth.

It certainly seems that large numbers of people in many different countries are open to new ways of organizing economic activity.

Martin Hart-Landsberg is a professor of economics at Lewis and Clark College. You can follow him at Reports from the Economic Front.

The National Employment Law Project (NELP) recently released a report about low-wage workers — those making less than $10 an hour. In 2011, 26% of private-sector jobs in the U.S. were low-wage jobs. These jobs were highly concentrated in a few industries. Just over half (52.1%) of all low-wage workers were employed in five sectors:

Most low-wage workers are employed by large businesses, those with more than 100 employees. NELP looked at the three largest employers of low-wage workers — Wal-Mart, Yum! Brands, and McDonald’s. All three have seen significant profit growth over the last four years:

The heads of these corporations are doing quite well, too:

Care 2 posted about the report and included additional details about low-wage workers. The relative worth of the minimum wage continues to decline, since prices for common consumer goods increase while the minimum wage is stuck at $7.25 an hour:

Finally, over at the Economic Policy Institute blog, David Cooper posted a table that provides an overview of the demographics of those who would be affected if Congress passed Senator Tom Harkin’s proposed bill that would raised the minimum wage to $9.80/hour:

Thanks to Dolores R. for the links!

Cross-posted at Montclair SocioBlog.

What’s familiar isn’t so bad, even if it’s bad.

One of the things I remember from my days in the crim biz is that people’s perceptions of crime don’t have a lot to do with actual crime rates.  This was back in the high-crime decades, and people were more afraid of crime than they are now.  But people felt safer in their own neighborhoods than in other neighborhoods, even when their own neighborhoods had a higher crime rate.

These were the days when I would give someone directions to my building — “Get off the IRT* at 72nd St…” — and they would often ask, “Is it safe?”

“Of course it’s safe.  It’s my neighborhood,” I would say, “I live here. I ought to know.”   Yet when I would go to a party in the East 20s or, God forbid, Brooklyn, I would emerge from the subway and follow the directions with a certain sense of apprehension and caution.

Apparently, the same link between far and fear holds true for people’s perceptions of economic well-being.  A recent Gallup poll asked people how the economy was in places ranging from their own city or area to the world generally.  The closer to home, the better the economy.  The farther from home, the lower the percent of people rating economic conditions as excellent or good.And the farther from home, the higher the percent of people rating economic conditions as “only fair” or poor.Republicans were the most pessimistic about the economy, regardless of location.  Democrats were the most sanguine, with Independents in between. The graph shows the percent who rated the economy positively minus the percent who rated it Poor.This obviously has nothing to do with familiarity but with contempt.  Apparently, for Republicans, a Democrat – especially a Kenyan socialist Democrat – in the White House means that the economy must be bad everywhere.

* These old subway line designations – IRT, BMT, IND – are no longer in official use.  But when did the MTA jettison them?  If you know the answer, please tell me.

———————

UPDATE, June 22 Andrew Gelman has formatted the data as line graphs, making the comparisons and trends clearer.  He has also added his own observations – things I wish I had known or thought of.